

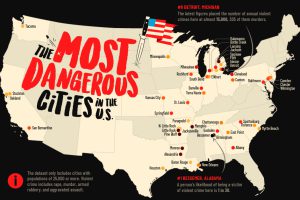
This map shows the most dangerous cities in the U.S. in terms of the violent crime rate per 1,000 residents. Read more
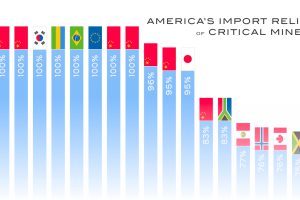
The U.S. is heavily reliant on imports for many critical minerals. How import-dependent is the U.S. for each one, and on which country? Read more
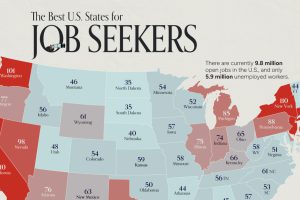
On average, there are 75 workers available for every 100 job openings across the country. Here’s how it varies by state. Read more
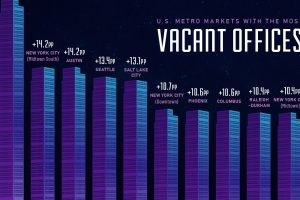
This visual showcases the top ten U.S. downtown areas with the fastest growing rate of vacant offices from the pre-pandemic era to 2023. Read more
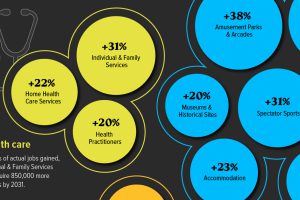
Key sectors in the U.S.—including Leisure and Health Social Services—are projected to be the fastest growing industries over the next decade. Read more
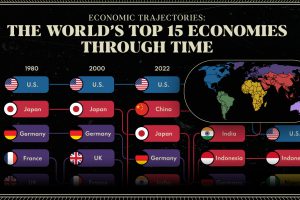
We provide a historical and predictive overview of the top economies in the world, including projections all the way to 2075. Read more

The majority of billion-dollar startups in the U.S. have at least one immigrant founder. Here is where those founders are from. Read more
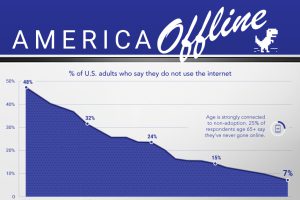
Internet adoption is widespread in the U.S. In fact, only 7% of Americans do not use the internet. Who are these non-adopters? Read more

Who are the wealthiest people in the United States? This map breaks down the richest billionaires in U.S. states. Read more
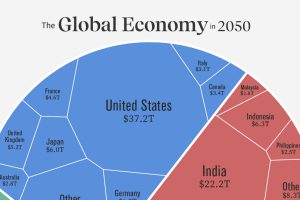
Asia is expected to represent the world’s largest share of real GDP in 2050. See how this all breaks down in one chart. Read more