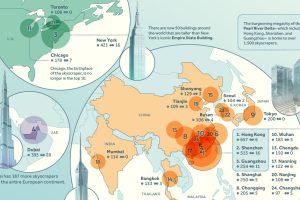
We rank the world’s leading cities with the most skyscrapers, highlighting China’s remarkable dominance in building vertically. Read more
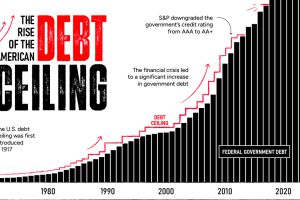
By June 1, a debt ceiling agreement must be finalized. The U.S. could default if politicians fail to act—causing many stark consequences. Read more
Reimagining all 200 million of the American workforce as 100 people: where do they all work, what positions they hold, and what jobs they do? Read more

There’s more to consider than the price tag when purchasing a house. This ranking reveals the most affordable U.S. cities for home buyers. Read more

Empty office space is hitting record highs in 2023. We show almost 1 billion square feet of unused space stacked as a single office tower. Read more
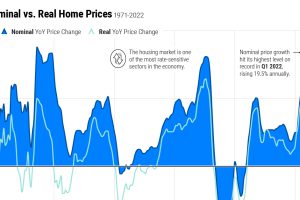
Home price growth has moderated amid rising interest rates and a narrow housing supply. Here’s how prices compare to historical trends. Read more

In this visual we showcase the relative size of the 100 largest U.S. banks in terms of consolidated assets. Read more
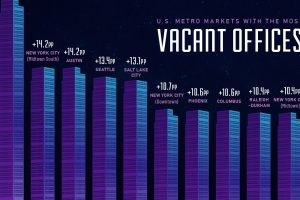
This visual showcases the top ten U.S. downtown areas with the fastest growing rate of vacant offices from the pre-pandemic era to 2023. Read more
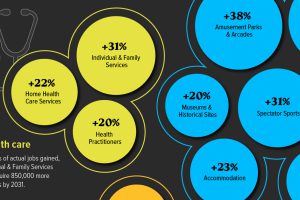
Key sectors in the U.S.—including Leisure and Health Social Services—are projected to be the fastest growing industries over the next decade. Read more
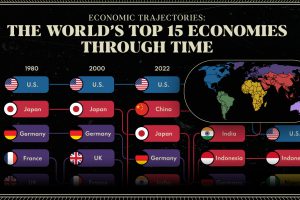
We provide a historical and predictive overview of the top economies in the world, including projections all the way to 2075. Read more

