

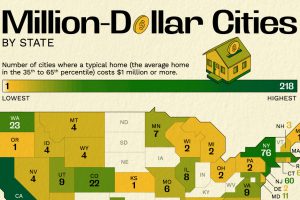
Million-dollar homes are on the rise in America. We show the number of cities in each states where a typical home costs $1 million or more. Read more
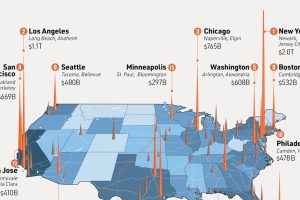
In this visual, we’ve ranked the top U.S. metropolitan areas in terms of their GDP. How does your city rank? Read more
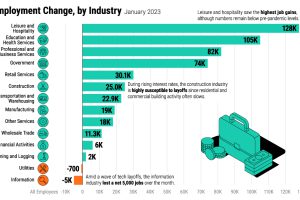
The U.S. labor market is remarkably strong, with a 3.4% unemployment rate. Which sectors are seeing the highest job gains in 2023? Read more
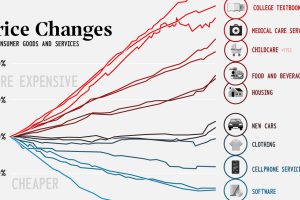
This century has seen divergent price movement. Many consumer goods are cheaper, while critical categories like health and education have skyrocketed. Read more

Who are the biggest trading partners of the U.S.? This visual showcases the trade balances between the U.S. and its trading partners. Read more
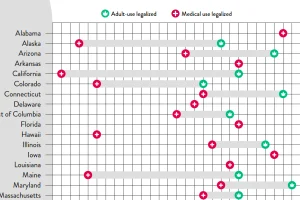
At the federal level, cannabis is illegal, but state laws differ. This graphic looks at the timelines of cannabis legislation in the U.S. Read more
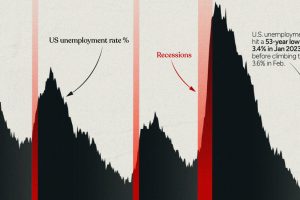
This infographic examines 50 years of data to highlight a clear visual trend: recessions are preceded by a cyclical low in unemployment. Read more
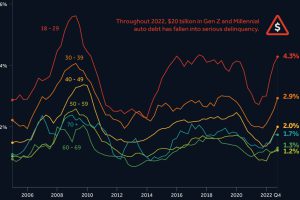
After a borrowing spree during COVID-19, younger Americans are struggling to keep up with their auto loan payments. Read more
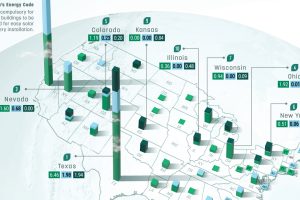
This graphic describes new U.S. renewable energy installations by state along with nameplate capacity, planned to come online in 2023. Read more
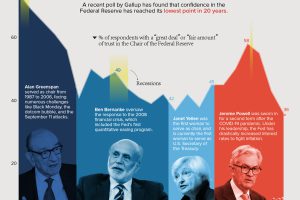
Public trust in the Federal Reserve chair has hit its lowest point in 20 years. Get the details in this infographic. Read more