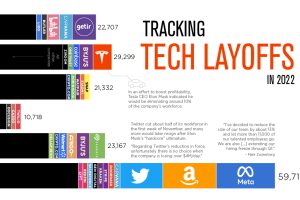
America has hundreds of options for quick and convenient food. But which fast food brands are the most popular, in terms of sales? Read more
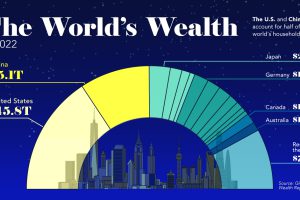
This visualization breaks down how household wealth is distributed around the world. Just 10 countries now account for 75% of total household wealth. Read more
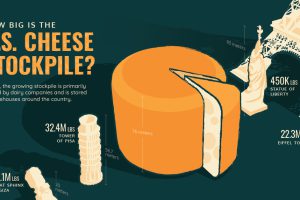
The U.S. has 1.5 billion pounds of cheese in cold storage across the country—around $3.4 billion worth of cheese. Read more
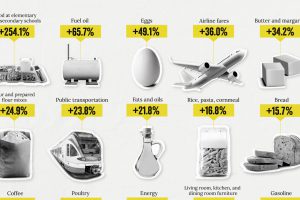
How has inflation impacted everyday goods like milk, flour, or fuel? This chart shows the annual change in the price of basic daily goods. Read more

Every year, there are hundreds of thousands of U.S. immigration visas issued by the government. See which countries receive the most in this visualization. Read more
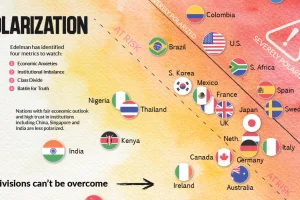
This chart plots polarization for various countries based on the Edelman Trust Institute’s annual survey of 32,000+ people. Read more

We dug into the World University Rankings 2024 to uncover America’s best universities across nine census regions. Read more

About 46% of the American workforce, or 62 million people, are employed in a small business. Here’s the share breakdown by state. Read more

This graphic shows U.S. high school and college student employment from 1993 to 2023, based on data from the U.S. Bureau of Labor Statistics. Read more


