
Stay up to date on the U.S. economy with this infographic summarizing the most recent Federal Reserve data released. Read more
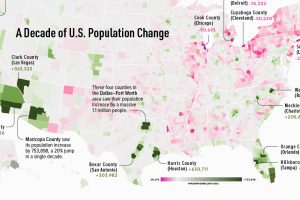
This map shows which counties in the U.S. have seen the most growth, and which places have seen their populations dwindle in the last 10 years. Read more

U.S. trade of goods amounted to nearly $4.6 trillion in 2021, and Canada, Mexico, and China were the country’s biggest trading partners. Read more

The U.S. has produced nearly 170 million firearms over the past three decades. Here are the numbers behind America’s gun manufacturing sector. Read more
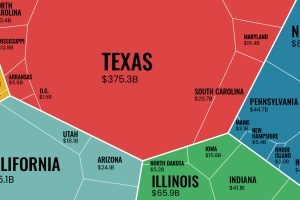
The U.S. exported $1.8 trillion worth of goods in 2021. This infographic looks at where that trade activity took place across the nation. Read more
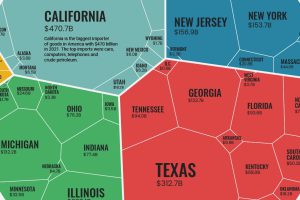
U.S. goods imports were worth $2.8T in 2021. From east coast to west, this visualization breaks down imports on a state-by-state basis Read more

Is owning a home still realistic? This map lays out the salary you’d need to buy a home in 50 different U.S. metro areas. Read more

Extra, extra read all about it—these 25 popular U.S. newspapers are trending downwards in their daily print circulation year-over-year. Read more
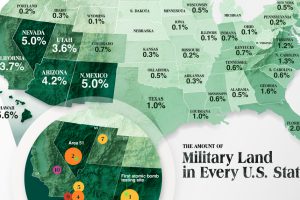
The U.S. military’s real estate portfolio is valued at $749 billion. Here’s a look at how much land the U.S. military controls in each state. Read more

Looking to start a business? This map reveals America’s best states to do business in, analyzing everything from workforce to infrastructure. Read more

