

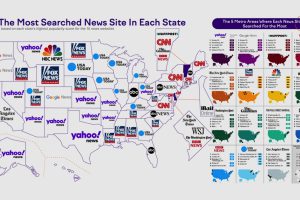
American states have some key differences for their favorite news sites. Here’s how they rank by monthly visitors and state popularity. Read more
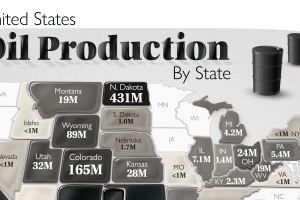
The U.S. is the largest oil producer in the world. Here we map the share of oil production in the country by all 50 states in 2020. Read more
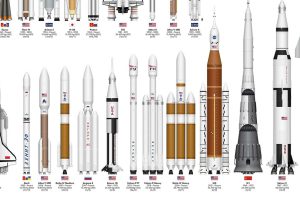
This infographic sizes up different rockets used to explore space, from the USSR’s Soyuz to the SpaceX Starship. Read more
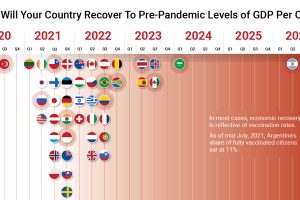
The path to COVID-19 recovery varies worldwide—some countries have already recovered, while others will not be back to normal for years. Read more
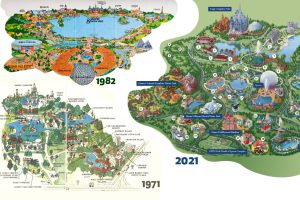
Historical maps highlight the Magic Kingdom’s dramatic transformation from swampland to the biggest theme park in the world. Read more
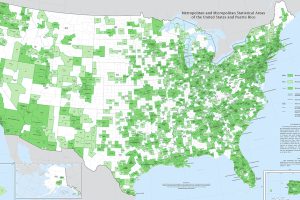
Fitting a complex population center into a tidy statistical box is no easy feat. Thankfully, this U.S. Census Bureau map is up to the challenge. Read more

From Fords in the Midwest to Toyotas on the coasts, here are the best selling vehicles in America, visualized by state. Read more
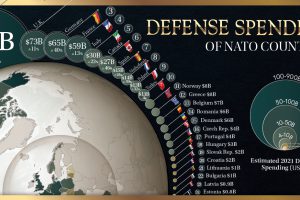
How much does each country in the military alliance contribute to NATO defense spending? We break it down with this map. Read more

This timeline visualization is a high-level record of what happened on the fateful morning of September 11, 2001 Read more

Here are the 30 most prescribed drugs in America, from blood pressure treatments to asthma medication. Read more