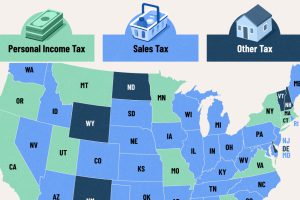
A vast majority raise the most through general and selective sales taxes. Here’s the single largest source of tax revenue for all 50 states. Read more
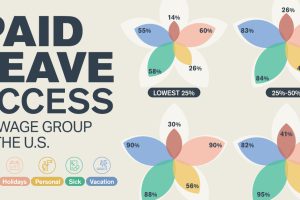
The U.S. is the only nation in the OECD without a federal paid time off mandate. We show how access to paid leave varies by income group. Read more
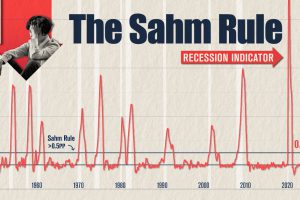
The Sahm Rule was triggered in July, but it may be overstating U.S. recession risk due to today’s unique job market dynamics. Read more
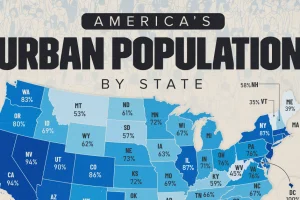
About 80% of the U.S. lives in cities. That’s 264 million people. But how does it vary per state? We investigate. Read more
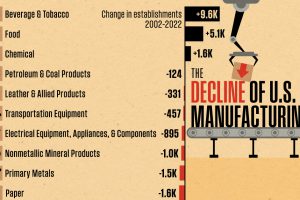
Over 45,000 U.S. manufacturing establishments have disappeared since 2002. In this graphic, we examine how the decline varies by sector. Read more
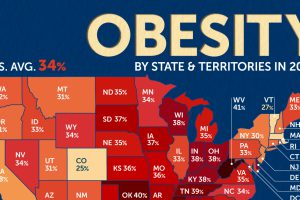
Three U.S. states recorded an adult obesity rate of 40% or higher in 2022. Which states saw the highest obesity rates? Read more
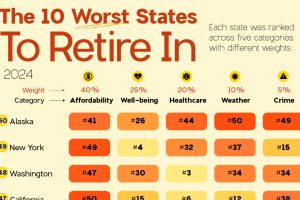
The worst states to retire in are those that are expensive and cold. But there’s a surprising warm weather entry as well. Read more
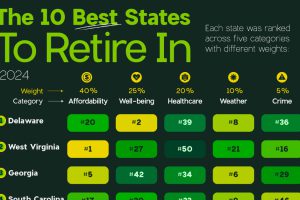
The best U.S. states to retire in are those that are affordable and warm. But #1 is from the mid-Atlantic region. Read more

Lumber prices in the U.S. continue to break records as pressure from both the supply and demand sides of the market collide. Read more


