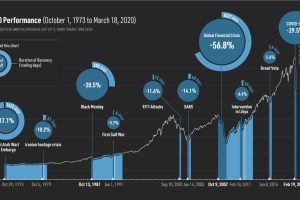
Black swan events like COVID-19 can cause market panics. However, markets have historically recovered—and such drops may offer long-term opportunities. Read more
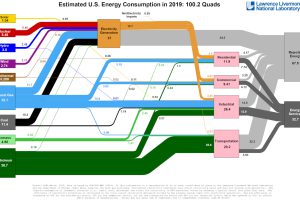
This incredible flow diagram shows how U.S. energy use broke down in 2019, including by source and end sector. Read more
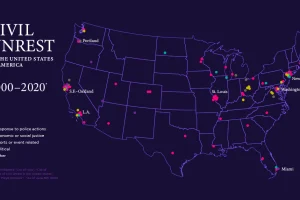
This map of civil unrest in the United States helps provide much needed context on how individual events fit within the nation-wide pattern over time. Read more
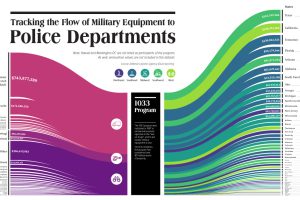
This visualization tracks the last decade of the 1033 Program, which provides free military equipment to police departments around the U.S. Read more
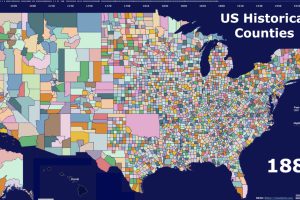
This video highlights the history of American counties, and how their boundaries have changed over the last 300 years. Read more
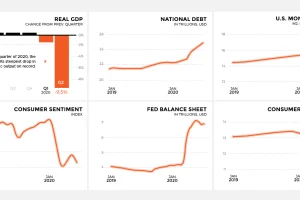
As COVID-19 spreads around the U.S. leaving economic upheaval in its wake, this snapshot reveals how major economic indicators are trending Read more
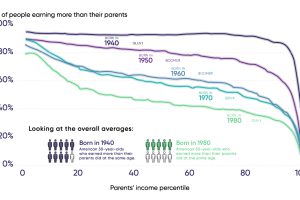
Each generation of Americans has historically earned more than their parents, but declining upward mobility is putting this growth at risk. Read more
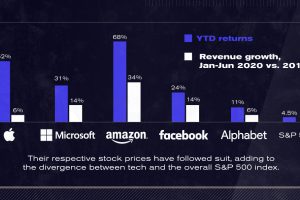
After a strong start to 2020, U.S. tech giants continue to advance to unprecedented highs. The Big Five now account for 25% of the S&P 500. Read more

Picking the right VP makes all the difference to a President’s success. We look at running mates of all Presidential hopefuls since 1940. Read more
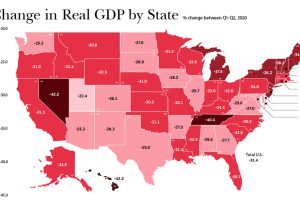
In just a few months, the U.S. economy reeled from COVID-19. As real change in GDP suffered, which states and industries were the hardest-hit? Read more

