Lions, tigers, and bears, oh my!—these animals do not feature on this list of popular American household pets. Read more
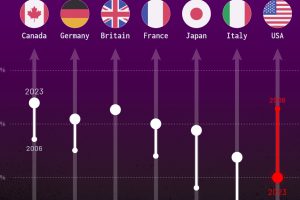
How much do you trust the government and its various institutions? We look at data for G7 countries for the time period of 2006-2023. Read more
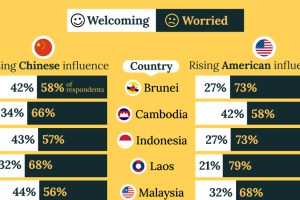
A significant share of respondents from an ASEAN-focused survey are not happy about rising American and Chinese influence in the region. Read more

In this graphic, we analyze the evolution of popular U.S. beer logos like Budweiser, Coors Light, Bud Light, and more. Read more
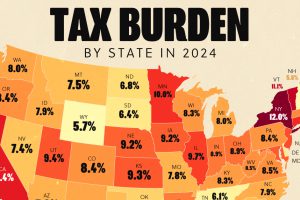
Tax burden measures the percent of an individual’s income that is paid towards taxes. See where it’s the highest by state in this graphic. Read more

In total, only nine countries have fully legalized recreational cannabis use. Read more
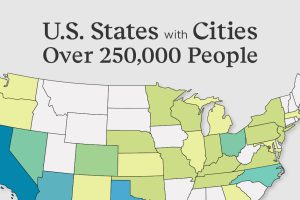
Eighteen U.S. States don’t have a single incorporated area with more than 250,000 people. Read more

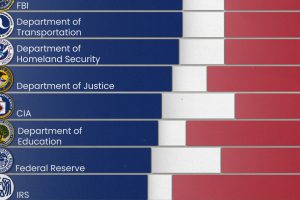
Predictably, results diverge when both Democrats and Republicans are asked to rate key government agencies in the United States. Read more
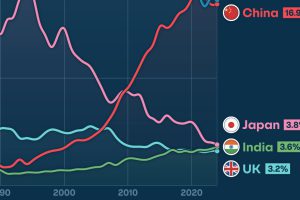
Gain a unique perspective on the world’s economic order from this graphic showing % share of global GDP over time. Read more


