

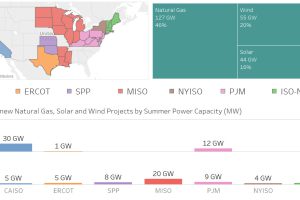
Nearly 100 GW of new power coming online is from solar and wind, making up 36% of new electrical capacity being added in these jurisdictions. Read more
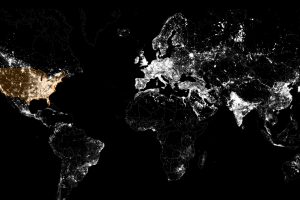
These satellite maps visualize where different energy sources, like fossil fuels, nuclear, or renewables, are used to generate electricity. Read more
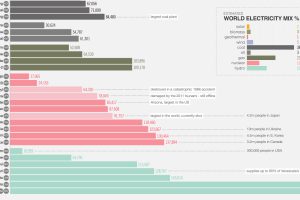
As global population grows, our energy demand grows as well. Here are the largest energy sources in the world and how much electricity they generate. Read more
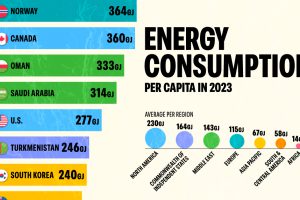
In 2023, the world consumed 2% more energy compared to 2022. Which countries consumed the most energy per capita? Read more
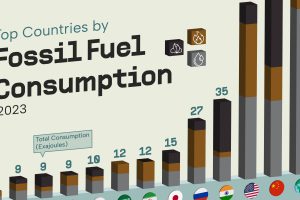
China and the U.S. account for nearly half of fossil fuel use. Read more
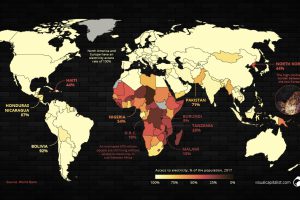
A surprising number of people around the world are still living without access to reliable electricity. This map shows where they live. Read more
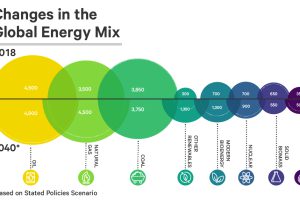
See how the world’s future energy mix is expected to change by 2040, using projections based on two different policy scenarios. Read more

Chinese companies are expected to hold nearly 70% of global battery capacity by decade’s end. Read more
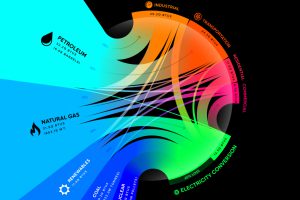
From renewables to fossil fuels, we’ve visualized the diverse mix of energy sources that powered U.S. energy consumption in 2020. Read more
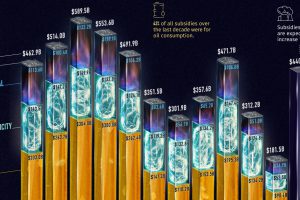
Governments pour nearly $500 billion into fossil fuel subsidies annually. This chart breaks down fossil fuel subsidies between 2010 and 2021. Read more