

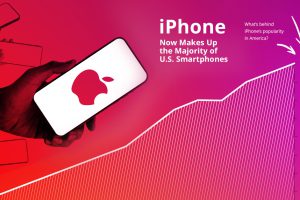
Apple’s flagship device has captured a modest 16% of the global market, and Android dominates globally. Why do so many Americans keep buying iPhones? Read more
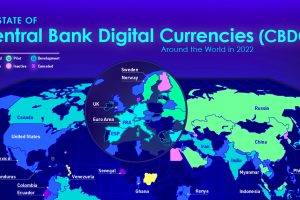
Central bank digital currencies are coming, but progress varies greatly from country to country. View the infographic to learn more. Read more
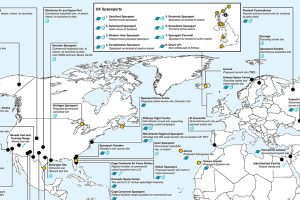
This map is a comprehensive look at both existing and proposed spaceports and missile launching locations around the world. Read more

From Twitter to TikTok, this infographic compares the universe of social media and messaging platforms by number of monthly active users. Read more
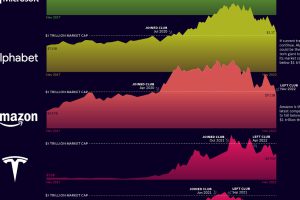
Economic woes and Fed tightening have taken their toll on the world’s most valuable companies. Here’s who is still part of the $1T club, and who’s not. Read more
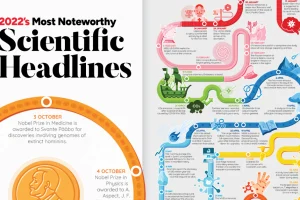
Join us as we look back at some of the most exciting, inspiring, and biggest science stories that made headlines in 2022. Read more
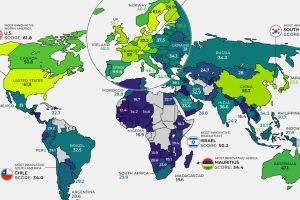
Here are the most innovative countries worldwide and the primary indicators—from patents to R&D spend—driving their breakthroughs. Read more
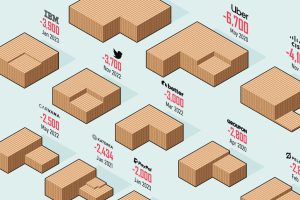
How bad are the current layoffs in the tech sector? This visual reveals the 20 biggest tech layoffs since the start of the pandemic. Read more

What exactly is generative AI and how does it work? This infographic, created using generative AI tools such as Midjourney and ChatGPT, explains it all. Read more
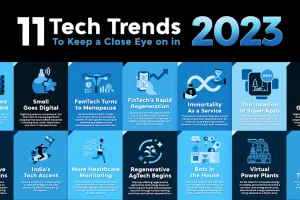
This infographic highlights eleven exciting areas within the world of technology worth keeping an eye on in 2023. Read more