

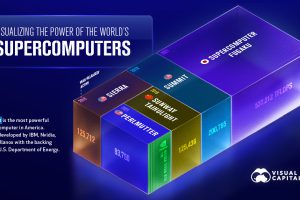
Supercomputers are some of the most advanced machines humans have ever created. See how they stack up in this infographic. Read more
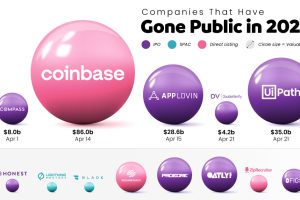
Tracking the companies that have gone public in 2021, their valuation, and how they did it. Read more

Feeling bored on social media? Consider investing in profile picture NFTs, one of the most popular digital assets being traded today. Read more
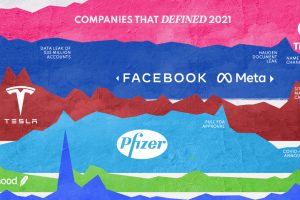
In 2021, a handful of companies dominated the conversation and influenced society in both positive and negative ways. Read more
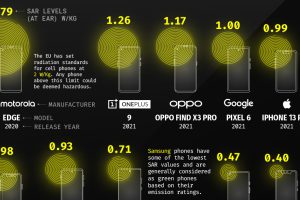
The parameter used to measure phone radiation emissions is the SAR value. Here we visualize the SAR values of some popular smartphones. Read more
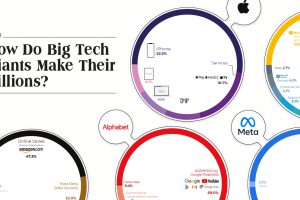
The Big Five tech companies made $1.4 trillion in revenue combined—more than Mexico’s entire GDP. Here’s how they earned it all. Read more

Six of the top 10 most downloaded apps in Q1 2022 were social media apps, and four of them are owned by Meta. Read more
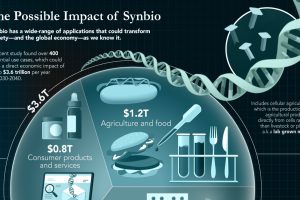
The field of synthetic biology could solve problems in a wide range of industries, from medicine to agriculture—here’s how. Read more
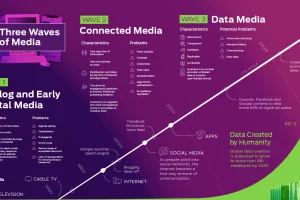
Media and information delivery is transforming at an increasing pace. Here’s why the future will be more data-driven, transparent, and verifiable. Read more
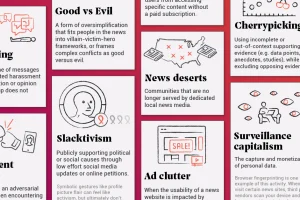
In this infographic, we catalog 33 problems with the social and mass media ecosystem. Read more