

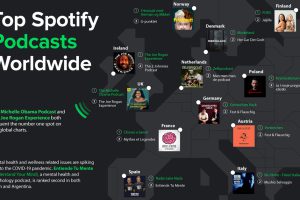
Podcasting is now a billion dollar industry, attracting big names and audiences to match. Here’s a global look at the top podcasts on Spotify. Read more
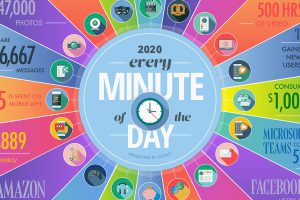
A lot can happen in an internet minute. This graphic looks at the enormous numbers behind the online services billions use every day. Read more
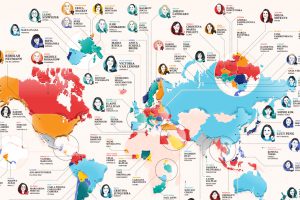
Who are the leading female founders worldwide? From Brazil to Singapore, we show the global landscape of companies with women at the helm. Read more

Nearly 6,000 satellites circle our tiny planet. About 60% are space junk, 40% are operational—and hundreds more are launched every year. Read more

By embracing uncertainty and making timely pivots, we visualize the bizarre origin stories of the most successful tech companies today. Read more
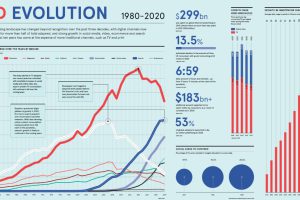
How has global advertising spending shifted over recent decades? We look at the data to see how both the industry and media have evolved. Read more
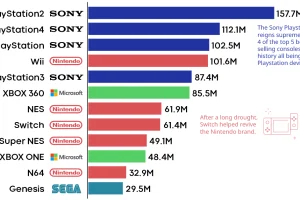
Between Switch and PlayStation5, gaming console sales are still going strong. Where will the future may take this multi-billion dollar industry? Read more
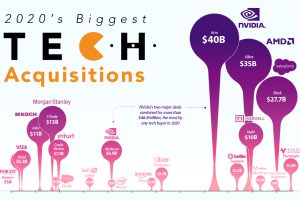
In a challenging year for most, many large tech companies have prospered and grown. We visualize the year’s biggest tech mergers and acquisitions. Read more

From rooms to revenue, this infographic breaks down the numbers behind the business of Airbnb—one of the most successful IPOs of 2020. Read more

Which cities have the most CCTV cameras? This map reveals the top surveillance cities worldwide in terms of the prevalence of CCTV cameras. Read more