

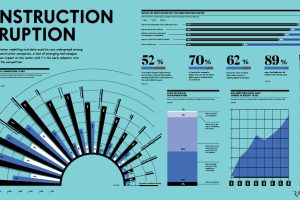
Emerging technologies are disrupting the construction industry, and having a major impact on the industry’s processes and bottom line. Read more
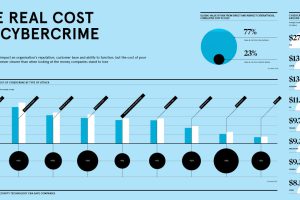
In recent years, cybercrime has become a top concern for organizations around the world. How much do these cyberattacks cost companies annually? Read more
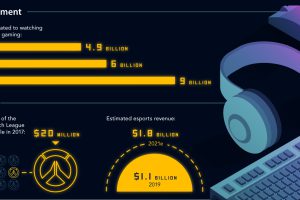
This infographic plots the journey of esports, from underground niche to a billion-dollar mainstream phenomenon—and it shows no signs of slowing down. Read more
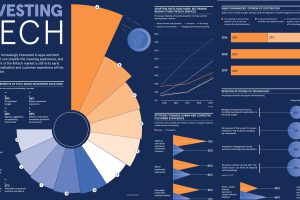
Visualizing the Rise of Investment Tech For the high resolution version of this infographic, click here. Investors and wealth managers are always looking to capitalize on their investments—and the latest… Read more

This infographic highlights some of the most promising nanotechnology breakthroughs in medicine, from ‘smart pills’ to targeted cancer treatment. Read more
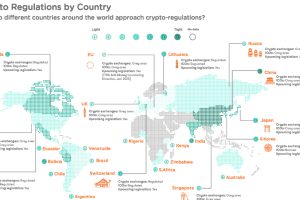
Cryptocurrency regulations are essential for the future of digital finance, making it more attractive for businesses, banks, and investors worldwide. Read more
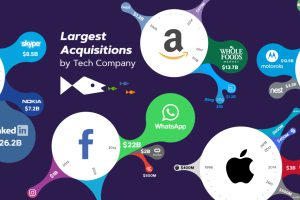
The ‘Big Five’ tech companies are rapidly reshaping the global tech landscape with their acquisitions, devouring any competitor who gets in their way. Read more
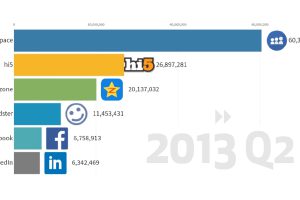
This animation provides an entertaining look at the popularity of social media platforms over time, from MySpace to TikTok. Read more

Microsoft aimed for carbon neutrality by 2030. Now its electricity use and carbon emissions are on the rise. Read more

This visualization ranks the most visited websites worldwide as of June 2024, based on data from SimilarWeb. Read more