

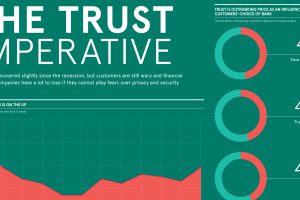
In the digital age, the issue of trust is emerging as the game-changing factor in how consumers choose financial services brands. Read more
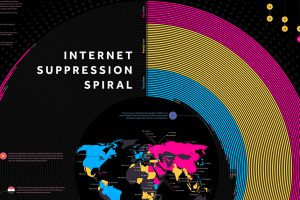
Freedom of speech on the internet has been on decline for eight consecutive years. We visualize the death spiral to show who limits speech the most. Read more

Banking talent is undergoing a fundamental shift. This infographic explores how banks are adapting to rapid automation and digitization in the industry. Read more
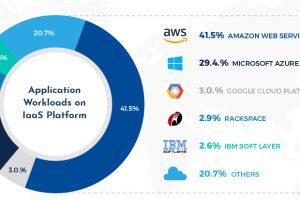
Do you watch Netflix or use Facebook? If so, then you are indirectly leveraging Amazon’s incredible scale and dominance of the cloud. Read more
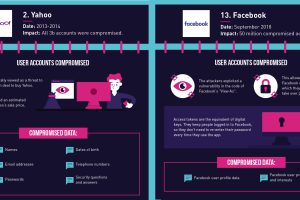
Did you know that 6.5 million data records are stolen each day? Here are the biggest data breaches over the years, and what happened in each case. Read more
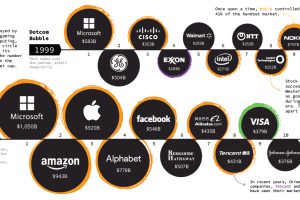
See how the world’s largest companies have changed over time, and how this helps tell a broader story about what the market is thinking. Read more
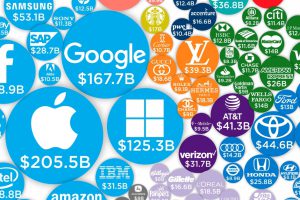
Technology brands account for 20 of the world’s 100 most valuable brands in 2019, combining for a whopping 43% of total brand value. Read more

See how consumer credit has evolved through the ages — from its ancient origins, to the use of game-changing technologies like artificial intelligence. Read more
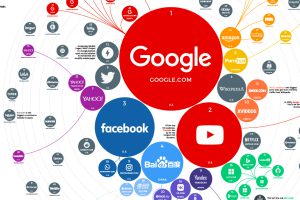
The top 100 websites ranking reveals how people around the world search for information, which services they use, and how they spend time online. Read more
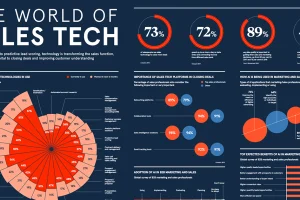
Sales technology tools today use AI to create personalized sales and marketing campaigns to find better prospects and close more leads. Read more