


The interactive graphic helps us to visualize the relationship between the supply and demand for over 1,400 technology skills. Read more
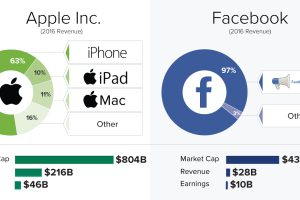
These five companies combined for $555 billion in revenues in 2016 – here’s a breakdown of each company’s revenue by product or service category. Read more

Unfortunately, fighting fake news may mean taking away the things that make the internet so great in the first place. Read more
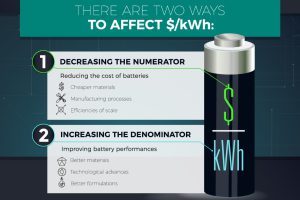
What’s the best way to reduce the $/kWh of li-ion batteries? Historically, it’s by advances in the cathode, and that may be the case for the future as well. Read more
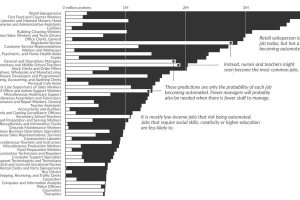
What types of jobs will be lost to automation? This data visualization applies probabilities from a well-cited study to current U.S. job numbers. Read more

Bitcoin’s rise has been meteoric, but it’s not the only crypto game in town. Investors should be aware of altcoins such as Ethereum, Ripple, and others as well. Read more
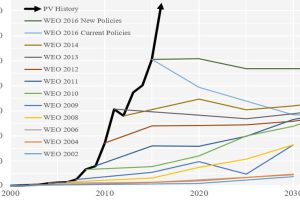
Forecasting the future of energy is not an easy task. These charts show how the experts have fared at forecasting solar over recent decades. Read more

There are already 1,500 satellites in orbit, but the Earth’s exosphere could become even more crowded. Here’s what satellites do, and what is on the horizon. Read more
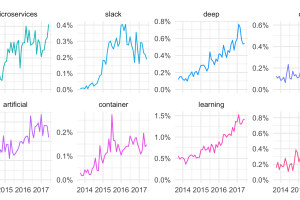
What ideas are gaining or losing traction with tech’s biggest influencers? We look at the data mined and visualized from one major tech community to find out. Read more
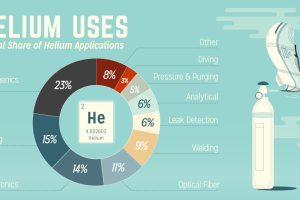
Helium is incredibly important for technology. Yet, because it is so light, it escapes into the atmosphere and is very limited in supply. Read more