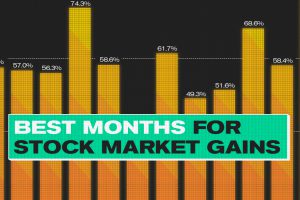
This infographic analyzes over 30 years of stock market performance to identify the best and worst months for gains. Read more

The markets in 2022 were characterized by a lot more pain than gain. That said, there were winners to be found, even during a turbulent year Read more
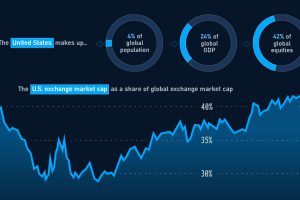
Despite having 4% of the world’s population, the value of U.S. equities still make up over 40% of the global total. Read more
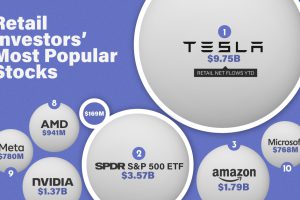
This infographic lists the 10 most popular stocks (or ETFs) that retail investors have been buying in 2023 so far. Read more
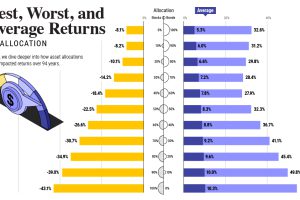
How have investment returns for different portfolio allocations of stocks and bonds compared over the last 90 years? Read more
This graphic visualizes the market capitalizations of America’s 15 largest semiconductor companies. Read more
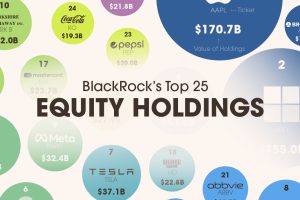
BlackRock is the world’s largest asset manager, with over $9 trillion in holdings. Here are the company’s top equity holdings. Read more

In this excerpt from our Markets This Month VC+ newsletter, we looked at how five portfolios of super investors shaped up at end of Q1 2023. Read more
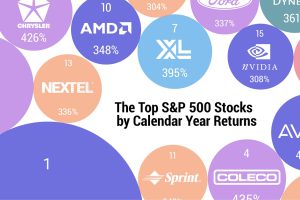
The highest one-year return among the top S&P 500 stocks from 1980 to 2022 was a staggering 2,620%. Which stocks top the ranks? Read more


