

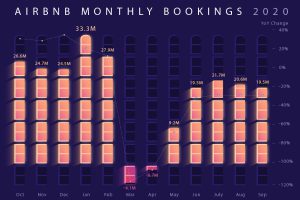
From rooms to revenue, this infographic breaks down the numbers behind the business of Airbnb—one of the most successful IPOs of 2020. Read more
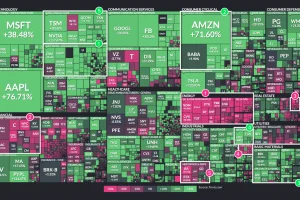
This treemap visualization shows the best and worst performing sectors of the stock market in 2020. We break down the winners and losers. Read more

This animation explains the basics of stock trading and touches on some strategies investors use to pick which stocks to purchase. Read more
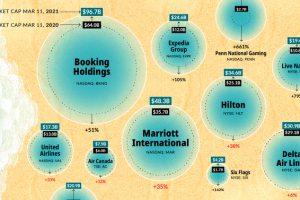
BEACH stocks—bookings, entertainment, airlines, cruises, and hotels—were pulverized at the beginning of the pandemic. Here’s how they’ve bounced back. Read more
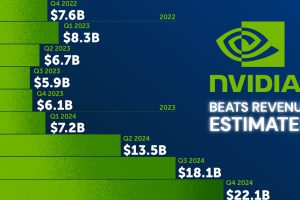
Nvidia beat Wall Street estimates for its second-quarter revenue for fiscal 2025, signalling that the AI boom is far from slowing down. Read more
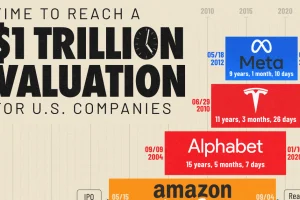
See how it long it took America’s most valuable companies, including Berkshire Hathaway, to reach a $1 trillion valuation in this graphic. Read more
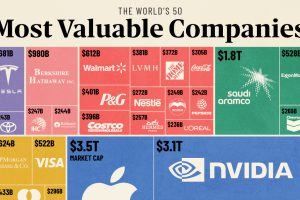
See a breakdown of the world’s 50 most valuable companies, which represent $34 trillion in combined market capitalization. Read more
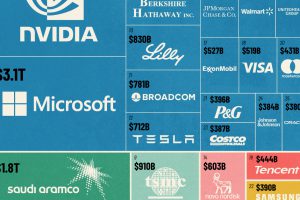
We combined the world’s top 25 companies by market cap into a single chart, based on August 2024 prices. Read more

The 100 biggest companies in the world were worth a record-breaking $31.7 trillion as of the end of Q1, up 48% year-over-year. Read more
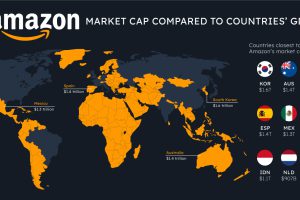
How do the big tech giants compare to entire countries? Here’s how Apple, Microsoft, and Amazon’s market caps stack up against national GDP. Read more