

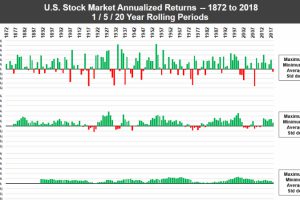
In any given year, the stock market can be a crapshoot – but over long periods of time, the U.S. market has consistently performed for investors. Read more
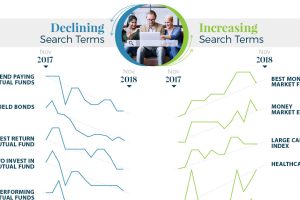
What types of investments are investors searching for? Get a unique picture of it in this infographic, which visualizes search trends between 2017 and 2018. Read more
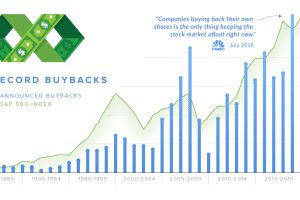
In 2018, companies announced over $1 trillion in stock buybacks. We explain what the proponents and detractors of buybacks are arguing about. Read more
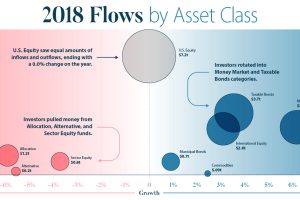
This infographic breaks down investment flows into funds (mutual funds, ETFs, etc.) over the course of 2018 to show how and when investors changed strategies. Read more
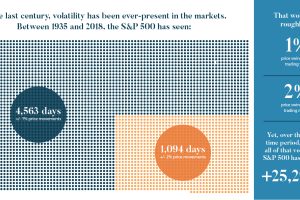
We look at the last century of markets to discover five important lessons about volatility. Here’s what you should know about volatility going forward. Read more
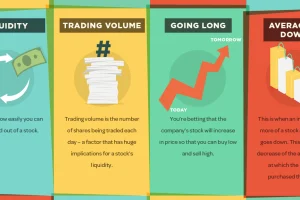
Getting a grasp on the market can be a daunting task for new investors, but this infographic is an easy first step to help in understanding stock market terms. Read more
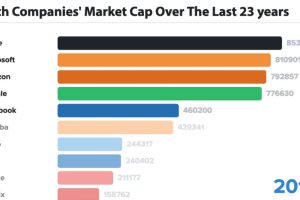
In business, the only constant is change – and for tech companies, this is even more true. Here are the biggest tech companies over 23 years. Read more
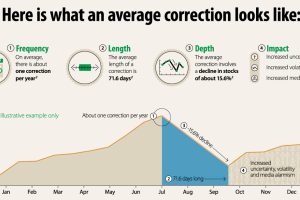
Why do stock market corrections happen, and how often does a market correction turn into a bear market? This infographic breaks it all down. Read more
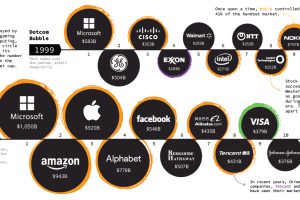
See how the world’s largest companies have changed over time, and how this helps tell a broader story about what the market is thinking. Read more
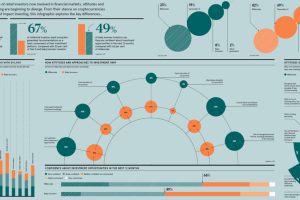
Each generation was shaped by unique circumstances, and these differences translate directly to the investing world as well. Read more