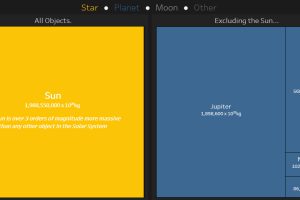
This interactive data visualization illustrates how the different planetary objects in our solar system compare based on their individual masses. Read more
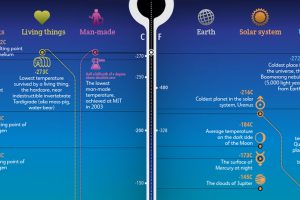
From the Big Bang to the Boomerang Nebula, this stunning data visualization puts the extreme temperatures of our universe into perspective. Read more
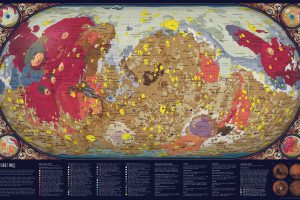
For centuries, humankind has looked at Mars from afar. In the past 75 years, space exploration has made it possible to create a map of Mars in extreme detail. Read more
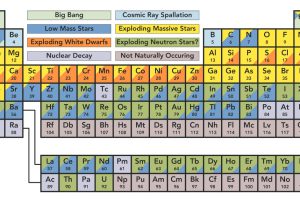
You’re likely familiar with the periodic table, but do you know the origin of elements? This graphic shows where our solar system’s elements come from. Read more

This striking map depicts all the stars and celestial bodies that are visible in the night sky, all on one giant backdrop. Read more

What is the surface of the Red Planet like? This beautiful map helps to break down the topography of Mars in awesome detail. Read more
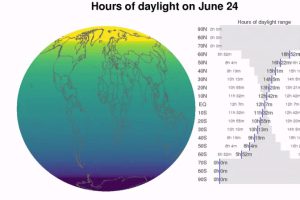
The length of your days can change depending on the seasons, and where you are on Earth. Watch how these patterns unfold over a year. Read more

The commercial space economy has been exploring new heights with innovative products and services that aim to improve life on Earth, and beyond. Read more
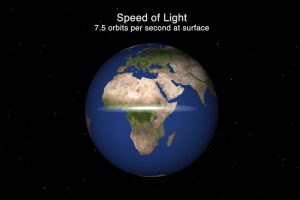
In our every day lives, light is instantaneous – but in the context of our solar system and beyond, light is surprisingly slow. Read more
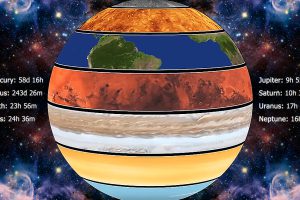
Rotation can have a big influence on a planet’s habitability. These animations show how each planet in the solar system moves to its own distinct rhythm. Read more

