

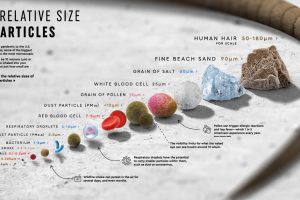
From wildfire smoke molecules to the coronavirus, this graphic compares the relative size of particles that we, for the most part, can’t see. Read more
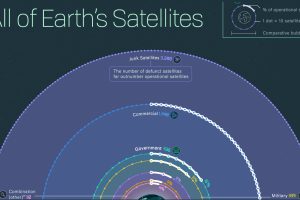
Nearly 6,000 satellites circle our tiny planet. About 60% are space junk, 40% are operational—and hundreds more are launched every year. Read more
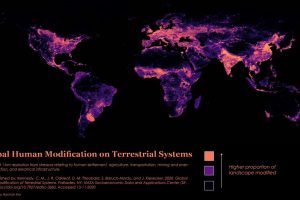
Nearly 95% of the Earth’s surface shows some form of human modification, with 85% bearing evidence of multiple forms of human impact. Read more
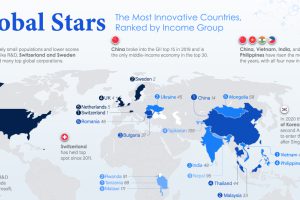
From Switzerland and China to Vietnam and Tanzania — here are the world’s most innovative countries, taking income per capita into account. Read more
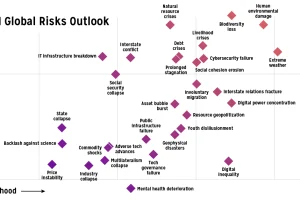
Which risks are top of mind in 2021? We visualize the World Economic Forum’s risk assessment for top global risks by impact and livelihood. Read more
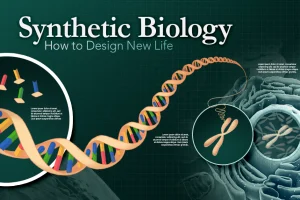
Synthetic biology (SynBio) is a field of science that involves engineering life for human benefit. Here’s an in-depth look at how it works. Read more
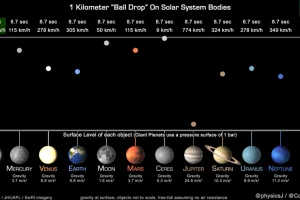
This unique animation, created by a planetary astronomer, compares and highlights the gravitational pull of the planets. Read more
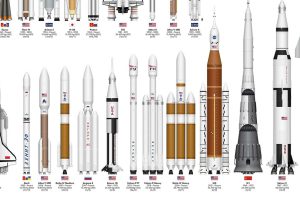
This infographic sizes up different rockets used to explore space, from the USSR’s Soyuz to the SpaceX Starship. Read more

Our planet supports nearly 8.7 million species. We break down the total composition of the living world in terms of its biomass. Read more
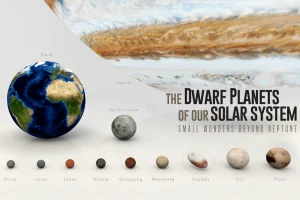
Since dwarf planets started being classified in 2005, nine have been recognized. Here we visually introduce the dwarf planets in our solar system. Read more