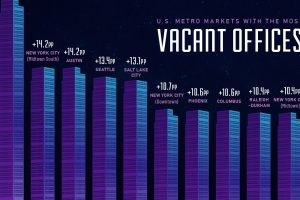
This visual showcases the top ten U.S. downtown areas with the fastest growing rate of vacant offices from the pre-pandemic era to 2023. Read more

At the height of its success, WeWork was valued at $47 billion. Four years later, WeWork is worth a fraction of the total. What happened? Read more
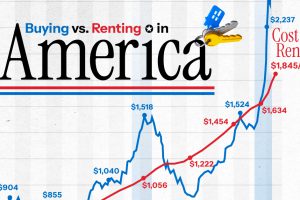
The U.S. has witnessed the biggest numerical gap in the monthly cost between buying a home and renting in over 50 years. Read more
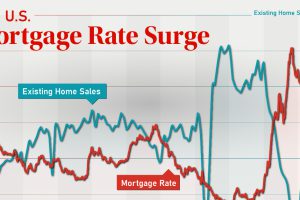
In this graphic, we take a look at the recent U.S. mortgage rate surge, and how the 30-year fixed-rate mortgage has evolved since 2013. Read more
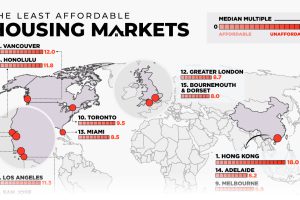
This map examines middle-income housing market affordability across eight major countries, highlighting some of the least affordable cities. Read more
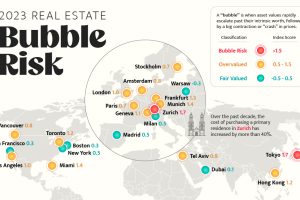
Despite higher mortgages and sharply correcting prices, some cities’ property markets are still in bubble-risk territory. Read more
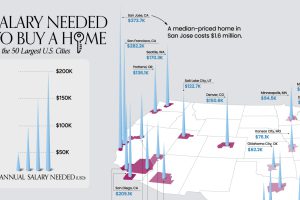
What does it take to own a home in the U.S. in 2023? Here’s a look at the salary needed for home ownership in the top 50 metro areas. Read more
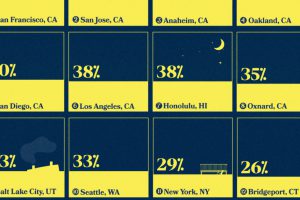
We highlight the top 15 U.S. metro areas by their percentage of million-dollar homes, from San Francisco to Miami. Read more
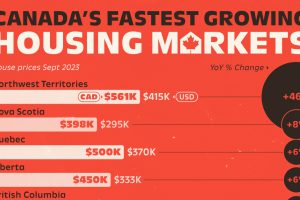
House prices are climbing at a brisk rate across most of the Great White North but one Canadian housing market is seeing outsized growth. Read more
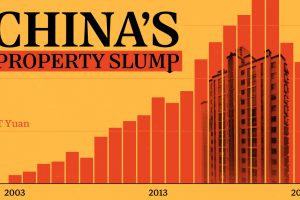
These charts show China’s real estate boom in the 21st century and the subsequent slowdown since 2022. Read more

