


Millionaires are more common than you may think – here are the steps you need to take with your retirement investments to become a 401(k) millionaire. Read more
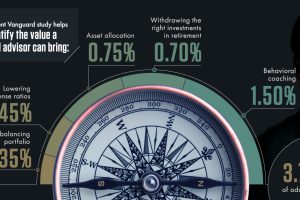
The right financial advisor can add up to 3.75% of value to your portfolio – but how do you find the right one that will serve your long-term interests? Read more
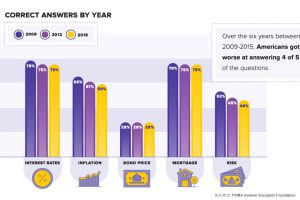
Financial literacy has been dropping for years in the United States – and with student debt at all-time highs, how do we put our students in a spot to succeed? Read more
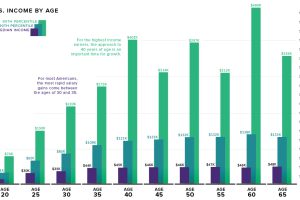
What is the relationship between age and income level? We visualize the data and compare it to commonly held beliefs on the topic. Read more

The investment universe is vast – but it’s also made up of many smaller components. See it all depicted in this nifty periodic table of investments. Read more
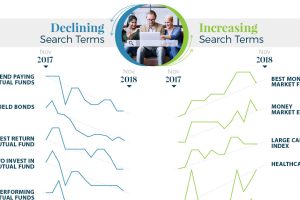
What types of investments are investors searching for? Get a unique picture of it in this infographic, which visualizes search trends between 2017 and 2018. Read more
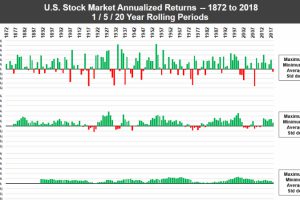
In any given year, the stock market can be a crapshoot – but over long periods of time, the U.S. market has consistently performed for investors. Read more
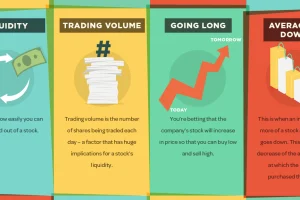
Getting a grasp on the market can be a daunting task for new investors, but this infographic is an easy first step to help in understanding stock market terms. Read more
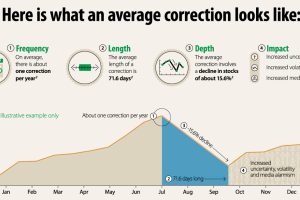
Why do stock market corrections happen, and how often does a market correction turn into a bear market? This infographic breaks it all down. Read more
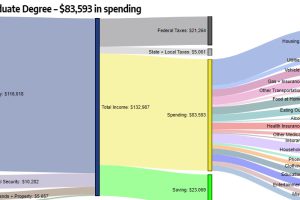
How do different types of education (high school, bachelor’s degree, etc.) correspond to level of income and household expenditures? Read more