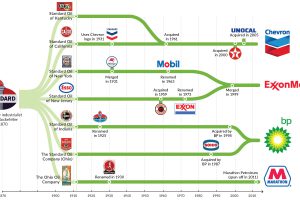
In 1911, John D. Rockefeller’s Standard Oil was broken up into 34 pieces by the Supreme Court. Today, the remnants form the base of the U.S. oil industry. Read more
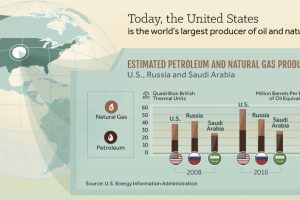
What role do independent oil and gas producers play in the energy industry – and how do these Craft Oil companies differ from the giants also in the sector? Read more
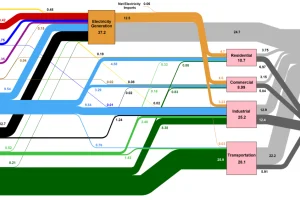
How is the country’s energy generated, and how is it consumed? This nifty Sankey diagram shows U.S. energy consumption in a simple and understandable way. Read more
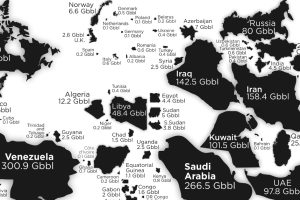
See the countries with the most oil reserves on this map, which resizes each country based on how many barrels of oil are contained in its borders. Read more
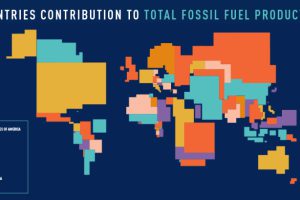
These four animated cartograms show the nations leading the world in fossil fuel production, in terms of oil, gas, coal, and total hydrocarbons. Read more
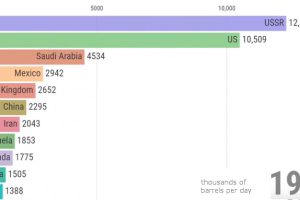
View how the ranking of the world’s largest producers of crude oil changes over a 50 year period, from the Cold War until today. Read more

It is counterintuitive, but electric vehicles are not possible without oil – these petrochemicals bring down the weight of cars to make EVs possible. Read more
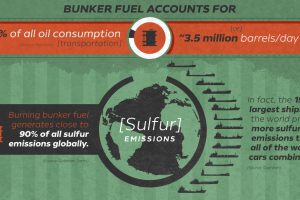
IMO 2020, which sets ambitious emissions limits, is about to shake up maritime shipping. Today’s graphic covers the environmental and economic impacts Read more
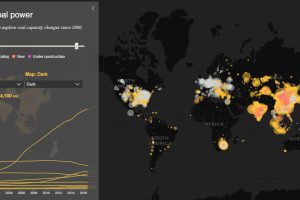
Today’s interactive map shows all of the world’s coal power plants, plotted by capacity and carbon emissions from 2000 until 2018. Read more


