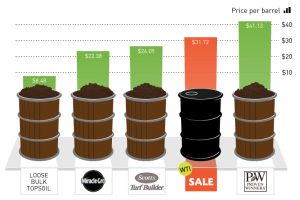
It costs the same amount as a barrel of Scotts Turf Builder. Read more
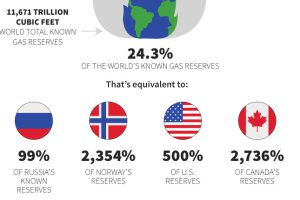
The Arctic is one of the last resource frontiers, and it is home to untapped amounts of resource wealth: oil, gas, and minerals. See how much could be there Read more
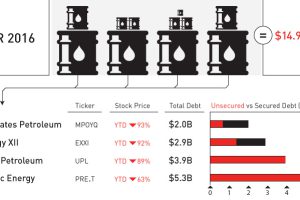
April was a record-setting month for bankruptcies in the oil patch. We put the 11 bankruptcies and $15 billion of outstanding debt in context. Read more
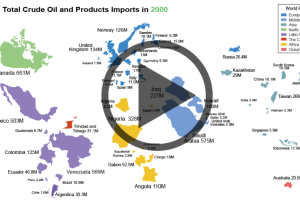
As the United States strives towards energy independence, watch how oil imports have dramatically shifted from the Middle East to a new oil source. Read more
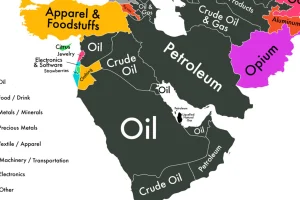
If we could only show you one map to explain the economy of the Middle East, it would be this one. Read more
There are multiple factors that determine how oil prices fluctuate, and many of them are interconnected. Learn about them all in this infographic. Read more
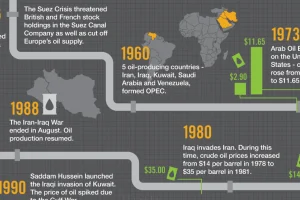
Oil is the world’s most traded commodity and a staple for investors – this infographic shows the volatile history of crude oil markets. Read more
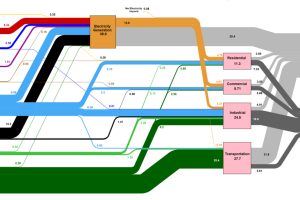
This massive diagram shows all energy created in the U.S., and where it goes. It’s not sexy, but it gives a great 10,000 ft overview of energy consumption. Read more


