

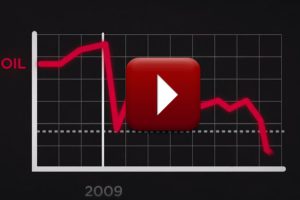
This infographic video shows the story behind oil’s plunge through 2014. Read more
Saudi Aramco, the Saudi Arabian oil and gas giant, is by far the biggest energy company in the world, generating $1 billion in revenue per day. Read more
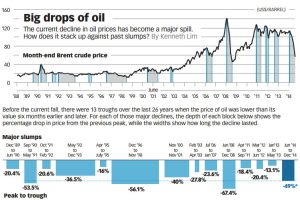
In the last six months of 2014, crude oil dropped 49% in price. How does this compare to other famous oil slumps in history? Read more
Looking back on 2014, this infographic sums up the major changes occurring in energy markets in oil, renewables, sanctions, and more. Read more
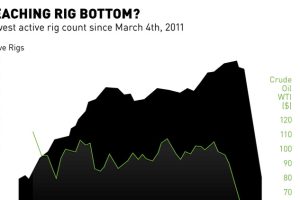
Oil rigs decline for the 17th straight week to 802, as drillers can do more with less. Yet, production is at highs and storage availability is running out. Read more
Black market rates for US dollars in Venezuela have jumped over the last two weeks dramatically, as citizens pay up to 400 Venezuelan bolívars for one dollar. Read more
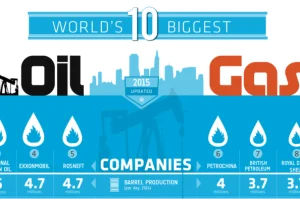
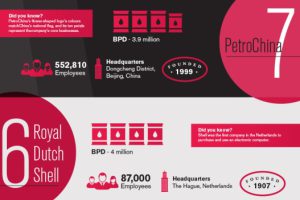
Ranking the world’s 10 biggest oil and gas companies by oil production per day, country, and production growth over the last decade. Read more
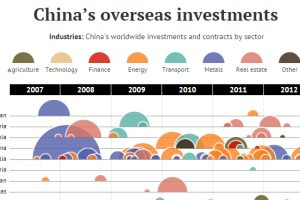
In this data visualization, every attempted Chinese overseas investment over $100 million is organized by country and sector. Read more
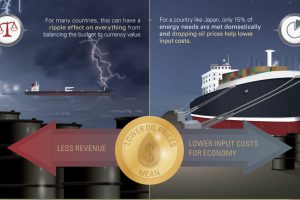
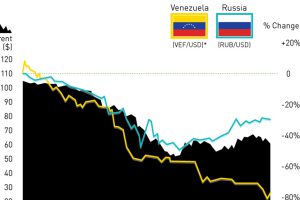
Plunging oil prices have profound effects on major importers and exporters of oil. In this case, we look at how currencies of net exporters are impacted. Read more
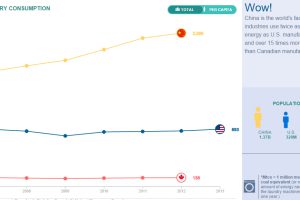
Compare the United States, China, and Canada side-by-side to see the differences in how these energy titans consume, produce, and import/export energy. Read more