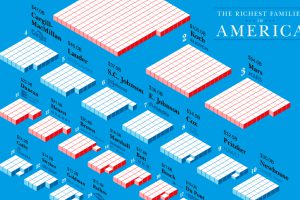
The net worth of the 50 richest families in America combines for $1.2 trillion. Here’s how multi-generational family wealth stacks up in the country. Read more
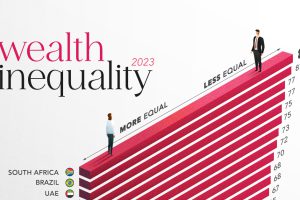
In the world’s most unequal country, the richest 10% control 80% of the wealth. In this graphic, we compare wealth inequality worldwide. Read more
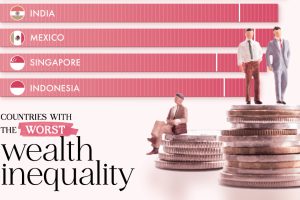
South Africa recorded the highest wealth inequality in 2023, as measured by the Gini index. Which other countries made the top 10? Read more

A vast majority raise the most through general and selective sales taxes. Here’s the single largest source of tax revenue for all 50 states. Read more

Based in Texas, Elon Musk is the wealthiest person on the list. Read more
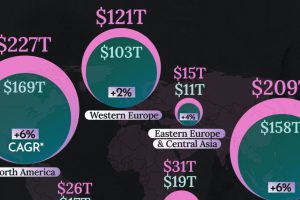
This graphic shows the latest forecasts for net wealth by region, highlighting the dominance of three key regions. Read more
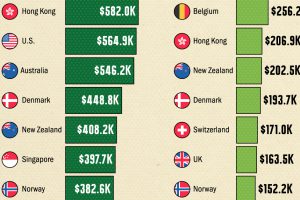
In this graphic, we show wealth per person by country, highlighting the richest nations in the world across average and median wealth. Read more
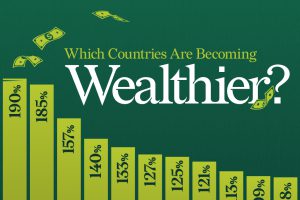
We compare net worth figures from 2010 and 2023 to uncover which countries are becoming wealthier over time. Read more
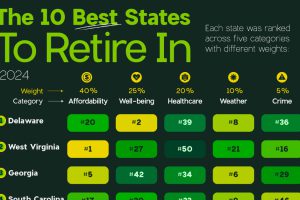
The best U.S. states to retire in are those that are affordable and warm. But #1 is from the mid-Atlantic region. Read more


