


From the Erie Canal to the Golden Gate Bridge, U.S. municipal bonds have financed crucial infrastructure. This infographic details their long history. Read more
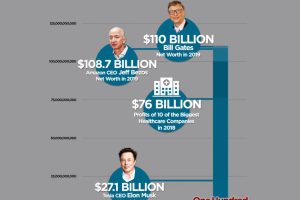
Bill Gates is the world’s wealthiest person again, with a fortune of $110 billion. This short animation helps visualize the extent of this wealth. Read more
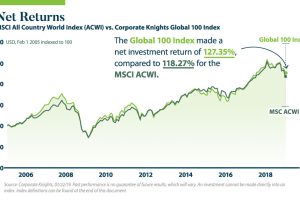
Do sustainable strategies underperform conventional ones? This infographic shines a light on the realities of sustainable investing and the ESG framework. Read more
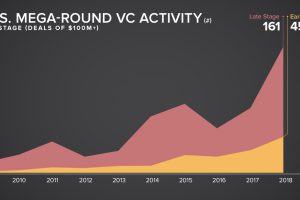
With bigger deals and multi-billion dollar IPOs, venture capital financing is reaching new heights. This infographic explores the latest trends. Read more

In 2020, China will lift the restrictions on foreign ownership, creating a significant investment opportunity that cannot be ignored. Read more

Structured notes provide some downside protection, while allowing investors to participate in market upswings. Learn all about them in this infographic. Read more
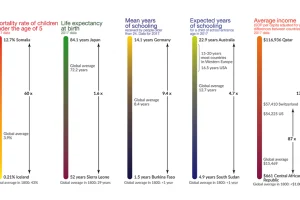
This visualization shows the global inequality gap — a difference in the standards of living around the world, as well as how it’s changed over 200 years. Read more

About 41% of CFOs spend the majority of their time on non-finance related activities. This infographic explores the expanding role of the CFO. Read more
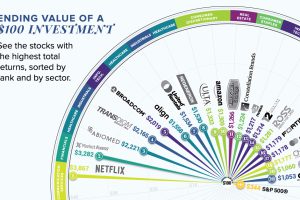
This graphic reveals the best-performing stocks over the last 10 years, and shows how much an initial $100 investment would be worth today. Read more
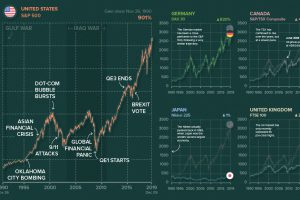
Ever wonder what other major stock markets would look like, if they were on the same scale of the S&P 500? We chart them all over a 30-year period. Read more