

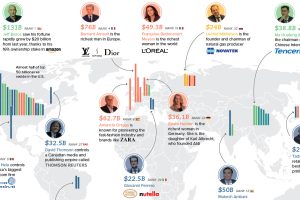
Where do the world’s top billionaires live, and how has this distribution changed over time? We take a look at the top 50 billionaires . Read more
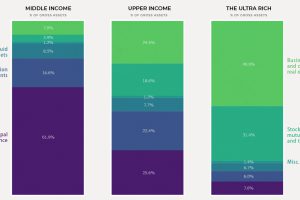
Today’s chart shows how the composition of wealth tends to change as net worth increases, illustrating the building blocks that make up household net worth. Read more
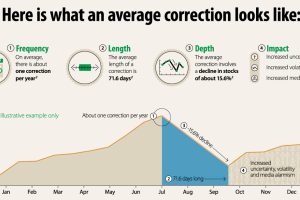
Why do stock market corrections happen, and how often does a market correction turn into a bear market? This infographic breaks it all down. Read more
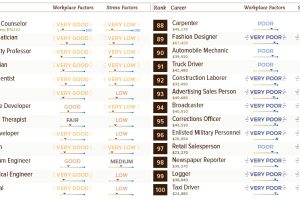
Not all jobs are created equal – see this list of 100 common careers ranked based on income, stress levels, growth potential, and other factors. Read more
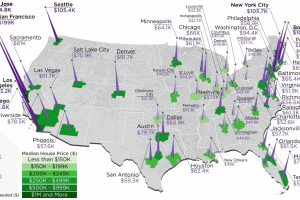
The annual salary needed to buy a home in the U.S. ranges from $38k to $255k, depending on the metropolitan area you are looking in. Read more

This telling chart shows how national wealth markets have changed over the past decade, highlighting the biggest winners and losers. Read more
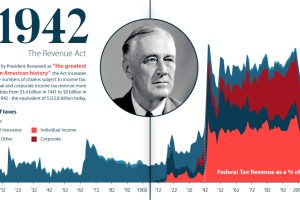
U.S. taxation has undergone massive changes over the last 250 years. From the American Revolution to modern reform, we explore its long history. Read more
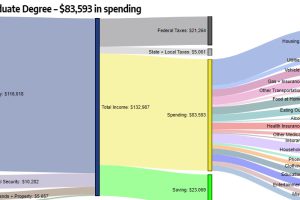
How do different types of education (high school, bachelor’s degree, etc.) correspond to level of income and household expenditures? Read more
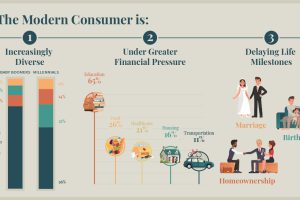
We all have a stereotypical image of the average consumer – but is it an accurate one? Meet the modern consumer, and what it means for business. Read more
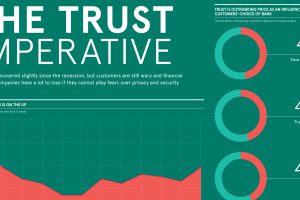
In the digital age, the issue of trust is emerging as the game-changing factor in how consumers choose financial services brands. Read more