

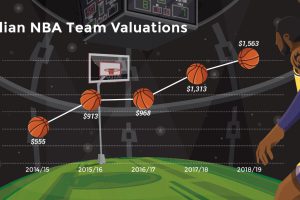
Buoyed by hefty broadcast agreements and superstars like LeBron James, NBA team valuations are hitting new heights. Let’s break down the data by team. Read more
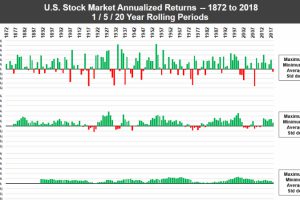
In any given year, the stock market can be a crapshoot – but over long periods of time, the U.S. market has consistently performed for investors. Read more
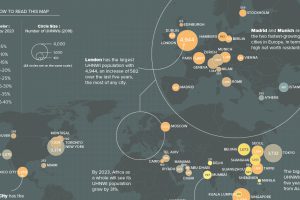
What cities are the world’s ultra-rich flocking to? This map looks at ultra high net worth individual (UHNWI) growth rates in cities around the world. Read more
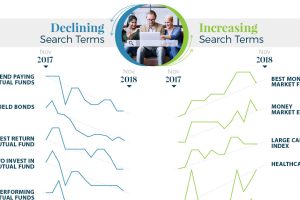
What types of investments are investors searching for? Get a unique picture of it in this infographic, which visualizes search trends between 2017 and 2018. Read more
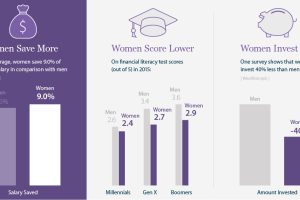
Women are better at saving money, but invest less of it – this infographic looks at the specific needs of women in investing and how to better serve them. Read more
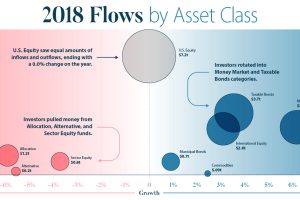
This infographic breaks down investment flows into funds (mutual funds, ETFs, etc.) over the course of 2018 to show how and when investors changed strategies. Read more
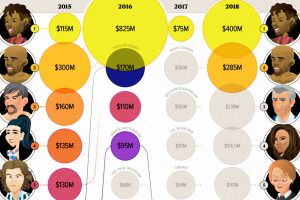
Celebrity status can be a powerful tool for building a fortune. These infographics visualize the world’s top earning celebrities, both living and dead. Read more
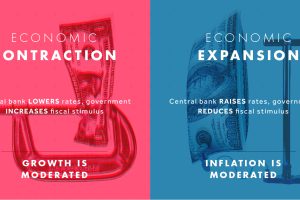
From climate change to aging populations, macro trends are changing the future. Here’s how to use them to your advantage. Read more
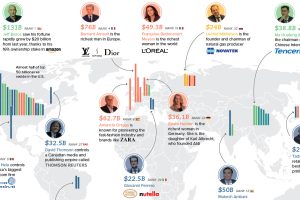
Where do the world’s top billionaires live, and how has this distribution changed over time? We take a look at the top 50 billionaires . Read more
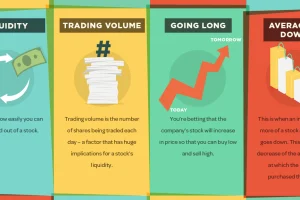
Getting a grasp on the market can be a daunting task for new investors, but this infographic is an easy first step to help in understanding stock market terms. Read more