


Our brain can be our own worst enemy. It’s hardwired to avoid pain, and to seek pleasure – and these instincts can wreak havoc on your investment portfolio. Read more
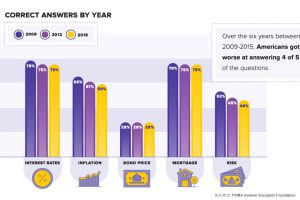
Financial literacy has been dropping for years in the United States – and with student debt at all-time highs, how do we put our students in a spot to succeed? Read more
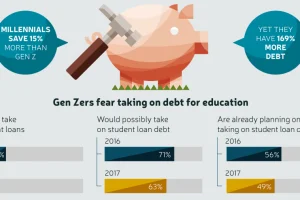
Gen Z saw their older friends take on massive amounts of debt, while struggling to secure stable jobs – and now they are learning from those mistakes. Read more
This interactive graphic shows the poverty rate of every state, and also how poverty levels have changed over time according to the U.S. Census Bureau. Read more
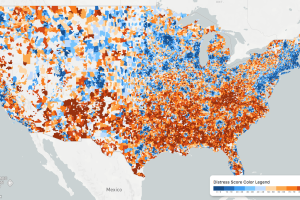
While the U.S. economic picture remains quite rosy, things change quickly when you zoom to the local level. This map shows the country’s distressed communities. Read more
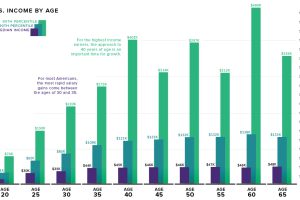
What is the relationship between age and income level? We visualize the data and compare it to commonly held beliefs on the topic. Read more
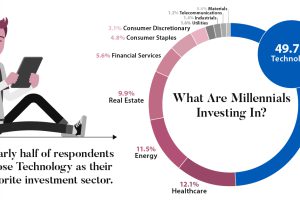
A survey of 9,800 millennials reveals what investing habits will define a generation set to receive a $30 trillion wealth transfer in the coming years. Read more
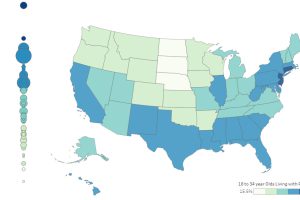
It’s estimated that 34.5% of young adults (18-34 years old) in the U.S live at home with their parents. Here’s how it varies by state, as well as over time. Read more
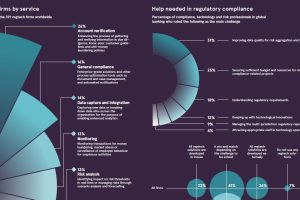
This infographic provides a glimpse into the world of regtech, a booming tech sector that’s helping financial firms to comply with onerous regulations. Read more
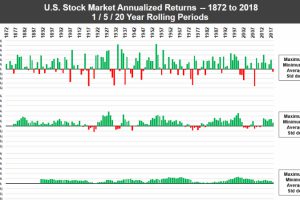
In any given year, the stock market can be a crapshoot – but over long periods of time, the U.S. market has consistently performed for investors. Read more