
See the cities that the ultra-rich are buying in – and which cities are the up-and-comers in the ever-changing market for luxury real estate. Read more
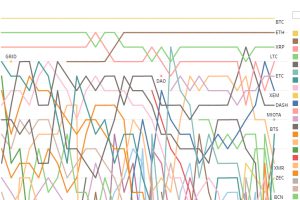
The coin universe is fast-moving and sometimes chaotic. See how the list of the top 20 cryptocurrencies has changed over the last 2.5 years. Read more
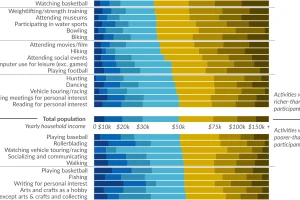
Ever wonder how people spend time? This data visualization shows favorite American past-times like playing baseball or watching TV by using income brackets. Read more

How much currency is printed each year? How long do bills last? Learn 38 facts on the modern U.S. dollar in this infographic. Read more
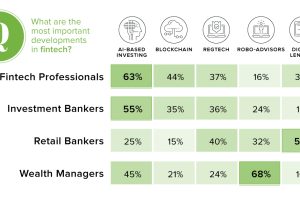
Is fintech a direct threat to the traditional financial services industry? Well, it turns out that the answer depends very much on who you are asking. Read more

We take financial services for granted – but there are billions of people globally without them. This presents a unique opportunity to bank the ‘unbanked’. Read more
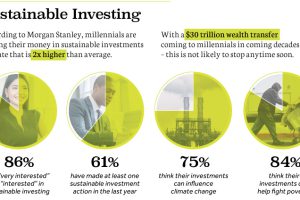
Money put towards ’causes’ has increased 33% in just two years to $8.7 trillion. See why sustainable investing has gone mainstream in today’s chart. Read more
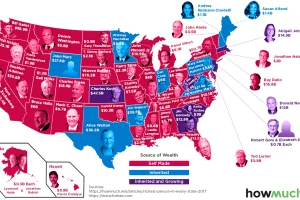
With fortunes ranging from $88.9B (Bill Gates) to $340M (Leonard Hyde), here is the richest person in each state in 2017, according to Forbes. Read more

We break down the world’s most valuable sports teams, how the list has changed over time, and how much winning championships helps to build franchise value. Read more
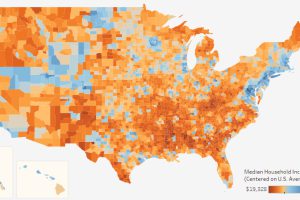
This interactive data visualization allows you to see median household income levels for every U.S. county – as well as the ability to sort data by state. Read more

