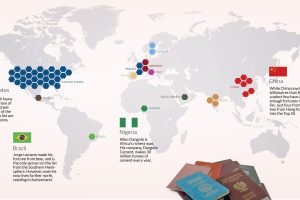
This stunning data visualization breaks down the top 50 wealthiest billionaires by industry, age, country, as well as the size of their fortunes. Read more

Today, credit cards are a key source of profits for big banks. But, it wasn’t always this way – the history of credit cards shows things were much different. Read more
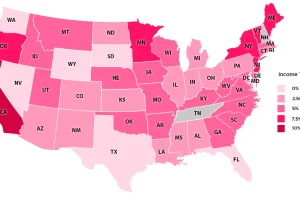
How green is the grass on the other side of the state border? See the U.S. states with the lowest income taxes in this series of maps and charts. Read more
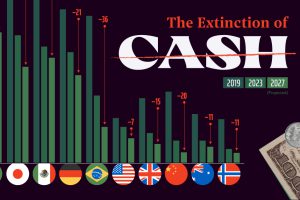
As credit cards and digital wallets increase in popularity, the world is seeing the death of cash as means of transaction. Read more
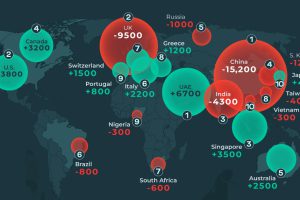
This graphic shows the countries expected to see the highest millionaire migration in 2024, both in terms of net inflows and net outflows. Read more
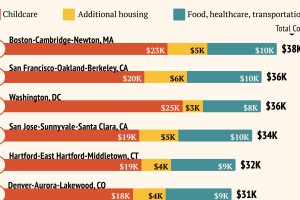
Raising a child in a large U.S. metro costs an average of $25k per year. Read more

This graphic illustrates the distribution of wealth in the United States from 1990 to 2023 by generation, from Millennials to Boomers. Read more

In this graphic, we show the wealthiest cities in the world based on the number of millionaires and billionaires in each metropolitan area. Read more
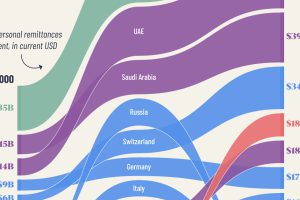
Countries which host large diasporas from around the world rank highly on this list of places sending the most remittances abroad. Read more


