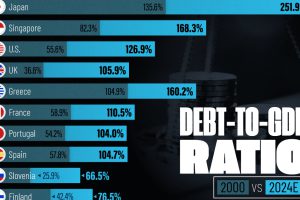
See how much the debt-to-GDP ratios of advanced economies have grown (or shrank) since the year 2000. Read more

Older, better-educated adults are winning the savings game, reveals a January survey by the National Opinion Research Center at the University of Chicago. Read more
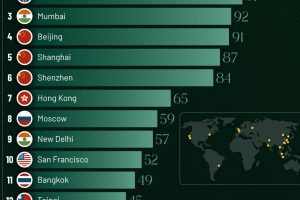
Just two countries account for half of the top 20 cities with the most billionaires. And the majority of the other half are found in Asia. Read more

According to the annual Hurun Global Rich List, the U.S. and China are home to nearly half of the world’s 3,279 billionaires in 2024. Read more

The 20 nations featured in this graphic each owe billions in debt to China, posing concerns for their economic future. Read more
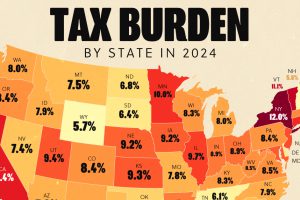
Tax burden measures the percent of an individual’s income that is paid towards taxes. See where it’s the highest by state in this graphic. Read more

A survey during peak tax filing season reveals two big complaints that Americans have with the federal tax system. Read more
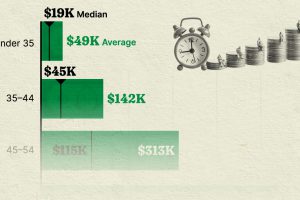
How much have Americans actually saved for retirement? We show average retirement savings by age amid a widening savings gap. Read more
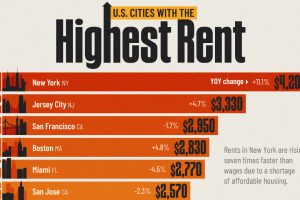
NYC tops the list with an average monthly cost of $4,200 for a one-bedroom apartment. Read more

A single adult needs to make at least $116k annually to live comfortably in Massachusetts. Read more

