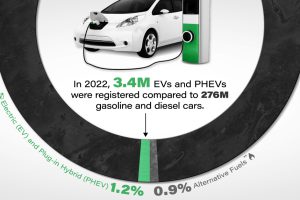
Although sales have been climbing, EV market share in the U.S. remains low as a percentage of all vehicles registered on the road. Read more

How poorly did ‘The Marvels’ perform in its opening weekend, and how do other Marvel box office returns compare? Read more

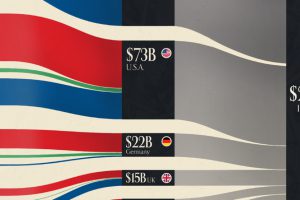
This graphic visualizes the top donors to Ukraine between January 2022, and July 2023. Read more

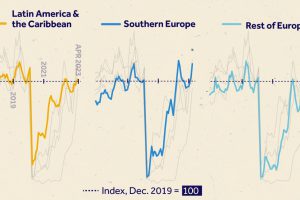
We visualize monthly foreign visitor arrivals, indexed to December 2019, indicating global tourism has all but recovered from COVID-19 disruptions. Read more

We visualize which cars depreciate the fastest based on the rate their value drops over five years. Spoiler: luxury cars don’t do well. Read more

In this graphic, we map out the 24 universal character strengths, reflecting the best traits found in everyone. Read more

Starbucks has nearly 40,000 stores in 80 different countries? But which countries account for the lion’s share of them? Read more

Cosmopolitans, Martinis, Rum and Cokes, even Bloody Marys—none of them take the crown for the most popular cocktail drinks for 2024. Read more


