

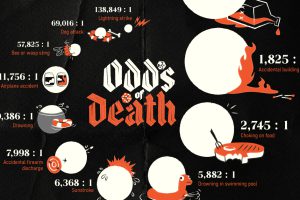
This infographic shows you the odds of dying from a variety of accidents, including car crashes, bee stings, and more. Read more
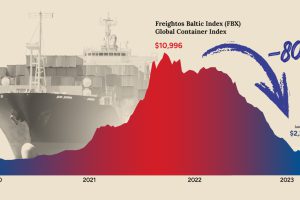
After a dramatic spike during the pandemic, shipping costs have now fallen back to Earth. What does that mean for shippers and the economy? Read more
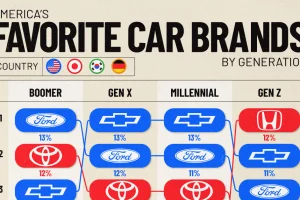
This ranking of America’s favorite car brands reveals some of Gen Z’s unique preferences when it comes to choosing a car. Read more
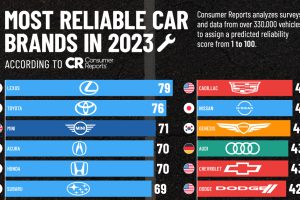
Consumer Reports ranked the most reliable car brands using surveys and analysis of over 330,000 vehicles. Which cars are most reliable? Read more
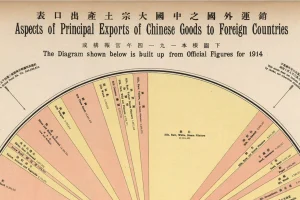
This pie chart, circa 1914, is a fascinating breakdown of China’s export economy just prior to World War I. Read more

The world can be a poisonous place. We look at a number of different biotoxins found in the natural world and rank their toxicity. Read more
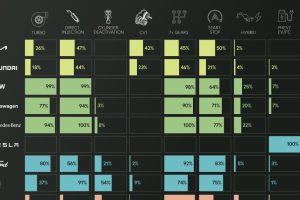
See how 14 major automakers have adopted various fuel-saving technologies in this infographic based on EPA data. Read more
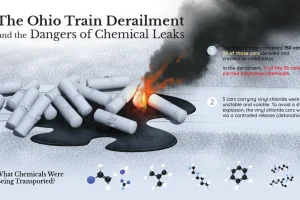
A train transporting a number of potentially dangerous chemicals derailed near the Ohio–Pennsylvania border. This infographic explains what happened Read more
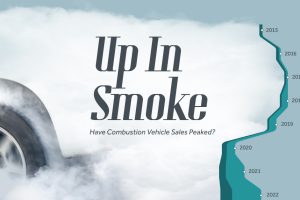
With EVs becoming more popular around the world, have combustion vehicles reached a peak? Find out in this infographic. Read more
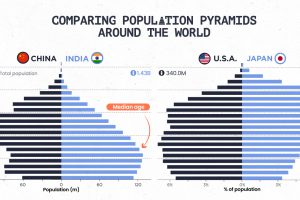
Population pyramids can show a country’s demographic advantages and challenges at a glance. See how different parts of the world stack up. Read more