

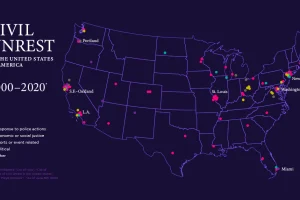
This map of civil unrest in the United States helps provide much needed context on how individual events fit within the nation-wide pattern over time. Read more
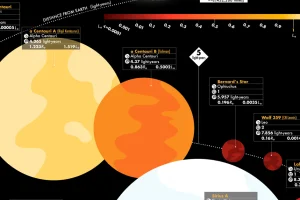
This graphic visualizes the 44 closest stars, revealing key facts such as distance from Earth, brightness, and whether potential planets are in orbit. Read more

How does coffee get from a faraway plant to your morning cup? See the great journey of beans through the coffee supply chain. Read more

This fascinating animated map provides an overview of the top trending Google searches in every state over the last decade. Read more

Since the 1990s, the opioid crisis has claimed thousands of lives. This visualization shows how the epidemic has come in three distinct waves. Read more
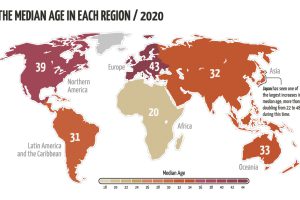
The world’s population is aging, but not at the same rate. This animated map visualizes the changes in median age in every region since 1950. Read more
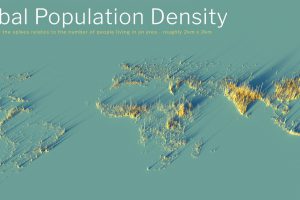
What does population density look like on a global scale? These detailed 3D renders illustrate our biggest urban areas and highlight population trends. Read more
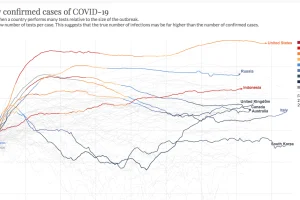
This continuously updated chart provides a more complete look at the efficacy of COVID-19 containment strategies. Read more
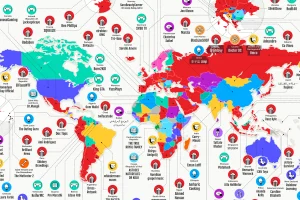
This interesting graphic gives an overview of the world’s most popular—and the highest paid—YouTubers in 187 different countries. Read more
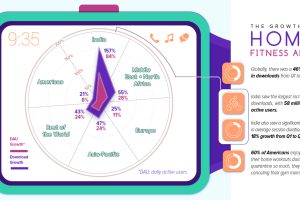
During lockdown, fitness apps have seen a huge spike in downloads worldwide. Which regions are driving this growth? Read more