Console games made up the majority of the 2023 gaming market share, generating $53.1 billion in revenue, but PC games are catching up. Read more

J.D. Power ranked the most reliable car brands in the U.S., based on the number owner-reported problems per 100 vehicles. Read more

Gambling spending grew in 32 of the 36 states covered in this analysis. Outliers include: Washington D.C., Florida, Indiana and Mississippi. Read more

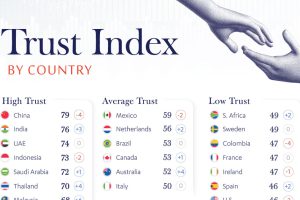
Global trust in government, business, and NGOs increased slightly since 2023. Which countries are the most and least trusting in 2024? Read more

Where and how do Americans get their news—as revealed by a YouGov survey tracking the most used news sources on a weekly basis. Read more

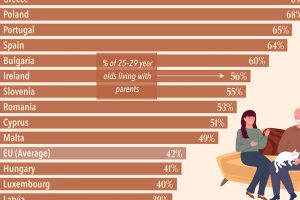
Analyzing the share of 25–29 year olds benefitting from or contributing to household incomes reveals the countries where adults still live at home. Read more

Animal resting heart rates vary significantly depending on factors like size and metabolism. Which creatures have the highest heart rates? Read more

Here are 18 of the most common mental mistakes in business and investing. Make sure to learn from these cognitive bias examples to make better decisions. Read more

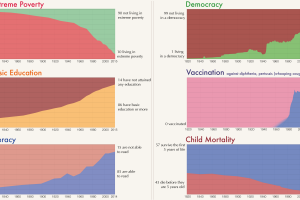
Long-term trends really allow you to see human progress on the most important indicators, like poverty reduction, education, democracy, literacy, and health. Read more

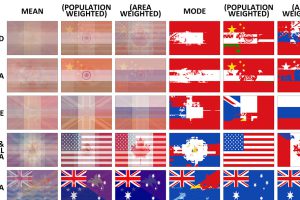
The average flag of the world, as well as different continents, if every flag were combined together. Also, a look at the building blocks of flag design. Read more

