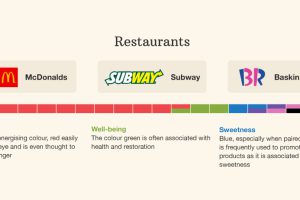
This infographic breaks down the colors used in branding across industries – and it shows how different colors can mean different things based on context. Read more
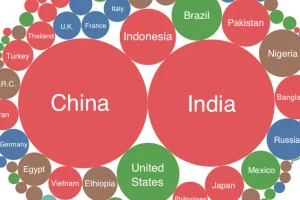
Every country is represented in this deceptively simple visualization. We then show all U.S. counties using a similar method, which might make you feel small! Read more
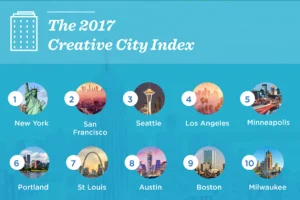
The creative economy is a vital contributor to economic health, but it’s a hard thing to measure. Here are some of the most creative cities in the U.S. Read more
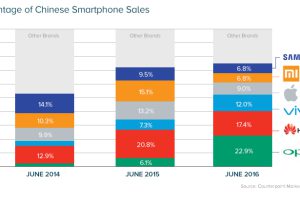
Triple-digit growth numbers are transforming Chinese brands, like Oppo and Vivo, into significant players in the global smartphone market. Read more
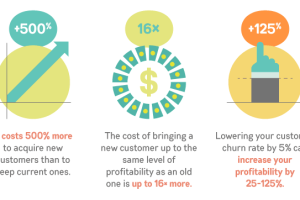
Acquiring a new customer is 500% more expensive than keeping an old one. Here’s five ways to build customer loyalty, based on behavioral psychology. Read more
Carved into a sandstone mountain near the North Pole is the world’s food backup plan. Learn about the Doomsday Vault, which holds millions of seeds to vital crops. Read more
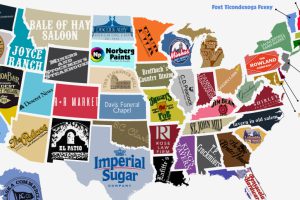
Is the oldest business in your state a well-known brand, or a mom-and-pop shop? This infographic shows the oldest company in each state in the U.S. Read more
YouTube, Facebook, and email are ubiquitous now, but they all started out with a single post, profile, or message. Take a trip down the memory superhighway. Read more

What’s the precise difference between ‘probable’ and ‘highly likely’? If you’re struggling to quantify those terms, then you’re not alone. Read more


