Home
Mining
Mining
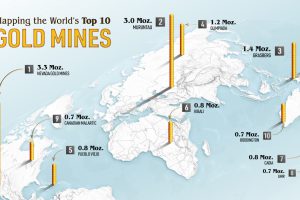
Gold mining companies produced over 3,500 tonnes of gold in 2021. Where in the world are the largest gold mines? Read more
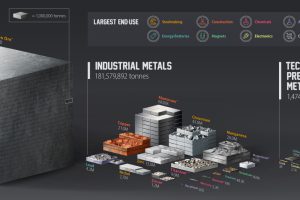
See all the 2.8 billion tonnes of metals mined in 2021. Read more
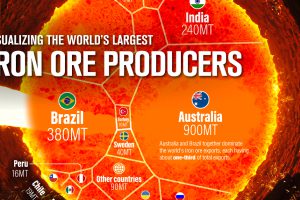
Iron ore made up 93% of the 2.7 billion tonnes of metals mined in 2021. This infographic lists the world’s largest iron ore producers. Read more
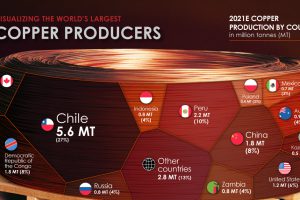
Many new technologies critical to the energy transition rely on copper. Here are the world’s largest copper producers. Read more
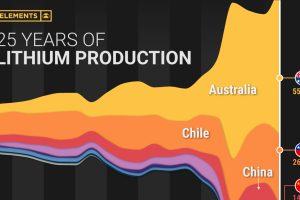
Lithium production has grown exponentially over the last few decades. Which countries produce the most lithium, and how how has this mix evolved? Read more
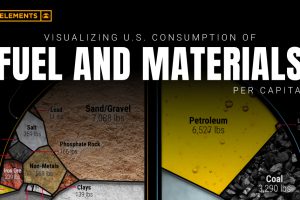
Wealthy countries consume large amounts of natural resources per capita, and the U.S. is no exception. See how much is used per person. Read more
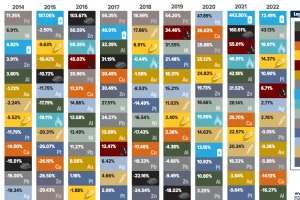
This table shows the fluctuating returns for various commodities over the past decade, from energy fuels to industrial and precious metals. Read more
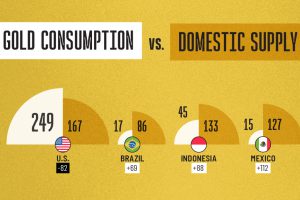
India’s consumption is 50 times higher than its domestic supply. Read more
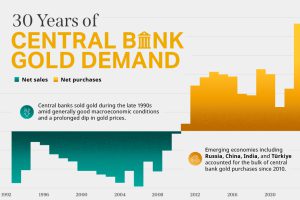
Globally, central banks bought a record 1,136 tonnes of gold in 2022. How has central bank gold demand changed over the last three decades? Read more
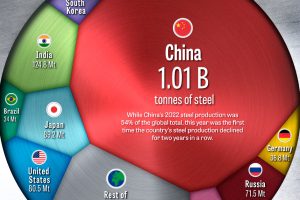
China has dominated global steel production the past few decades, but how did the country get here, and is its production growth over? Read more

