Charted: $5 Trillion in Global Commodity Exports, by Sector

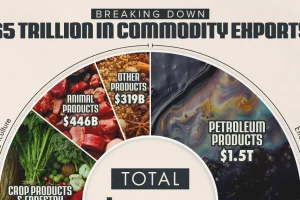
The energy sector accounts for 40% of the value of global commodity exports. And there’s a key product within it that dominates international trade. Read more

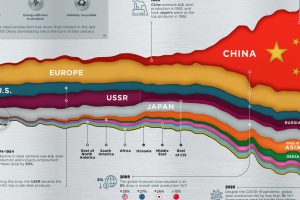
Visualizing 50 Years of Global Steel Production

Global steel production has tripled over the past 50 years, with China’s steel production eclipsing the rest of the world. Read more

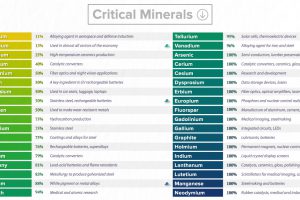
Visualizing the Critical Metals in a Smartphone

Smartphones can contain ~80% of the stable elements on the periodic table. This graphic details the critical metals you carry in your pocket. Read more
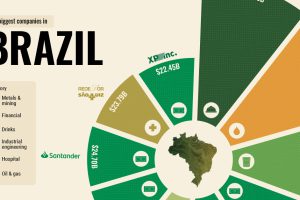
The Top 10 Biggest Companies in Brazil

What drives some of the world’s emerging economies? From natural resources to giant banks, here are the top 10 biggest companies in Brazil. Read more

Rare Earth Elements: Where in the World Are They?

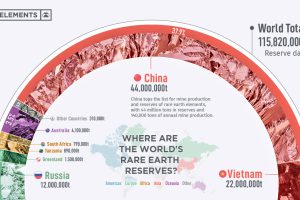
Rare earth elements are the critical ingredients for a greener economy, making their reserves increasingly valuable to global supply chains. Read more
Mapped: Solar Power by Country in 2021

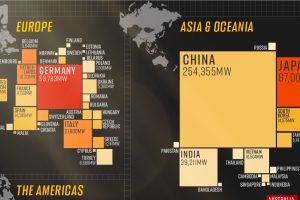
In 2020, solar power saw its largest-ever annual capacity expansion at 127 gigawatts. Here’s a snapshot of solar power capacity by country. Read more

Visualizing the Abundance of Elements in the Earth’s Crust

The Earth’s crust makes up 1% of the planet’s volume, but provides all the material we use. What elements make up this thin layer we stand on? Read more

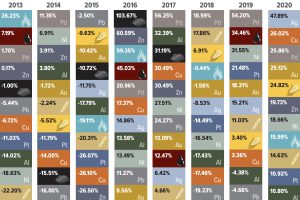
The Periodic Table of Commodity Returns (2012-2021)

Energy fuels led the way as commodity prices surged in 2021, with only precious metals providing negative returns. Read more

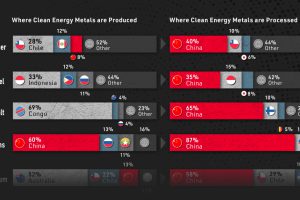
Visualizing China’s Dominance in Clean Energy Metals

Despite being the world’s biggest carbon emitter, China is also a key producer of most of the critical minerals for the green revolution. Read more

The 50 Minerals Critical to U.S. Security

This graphic lists all minerals that are deemed critical to both the economic and national security of the United States. Read more