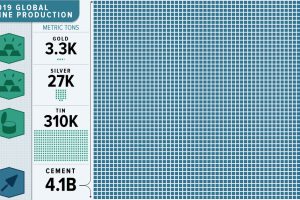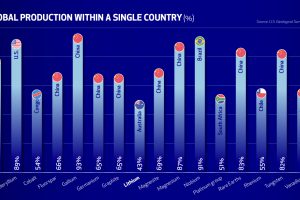
All the World’s Metals and Minerals in One Visualization

This massive infographic reveals the dramatic scale of 2019 non-fuel mineral global production. Read more

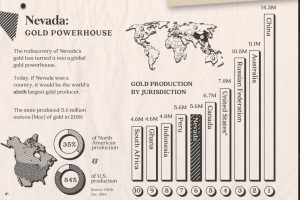
Gold in Nevada: The Real Golden State

Nevada accounts for 84% of U.S. gold production today. Here’s a look at the state’s rich history, its prolific production, and what the future may hold. Read more

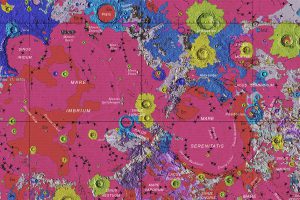
Mapped: The Geology of the Moon in Astronomical Detail

Behold the glory of the Unified Geologic Map of the Moon, which brings decades of data into one map, revealing the potential for exploration. Read more

The New Energy Era: The Impact of Critical Minerals on National Security

The U.S. finds itself in a precarious position, depending largely on China and other foreign nations for the critical minerals needed in the new energy era. Read more
How to Avoid Common Mistakes With Mining Stocks (Part 2: Business Plan)

Investing in mining stocks may seem like luck of the draw, but the sector can be de-risked by asking the right questions. Here we look at the business plan. Read more

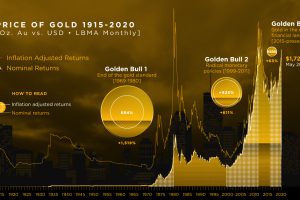
Golden Bulls: Visualizing the Price of Gold from 1915-2020

We break down gold’s three major bull markets over the last century. This includes the current one, in which gold has hit 8-year highs. Read more

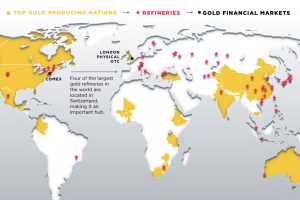
The Impact of COVID-19 Shutdowns on the Gold Supply Chain

Chains are only as strong as their weakest link. The COVID-19 shutdowns affected every link in the gold supply chain, from producers to end-users. Read more

How to Avoid Common Mistakes With Mining Stocks (Part 3: Jurisdiction)

“Location, location, location…” This famous real estate adage also matters in mining. After all, it’s an industry that is all about the geology—but beyond the physical aspects and the location… Read more
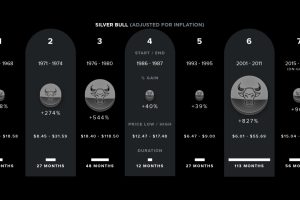
Silver Bulls: Visualizing the Price of Silver

Silver has always proved its value throughout history. From ancient coins to jewelry, silver retains its value and goes through tough times. Read more

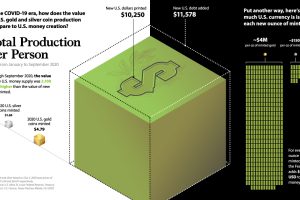
Visualizing U.S. Money Supply vs. Precious Metal Production in the COVID-19 Era

Amid trillions in COVID-19 stimulus, this graphic compares new U.S. dollars printed to U.S. precious metal coin production. Read more