Last year, U.S. stocks took investors by surprise. This graphic shows S&P 500 historical returns since 1875 to put 2023 returns into context. Read more

The model mix in tesla’s global sales numbers has slowly changed from its luxury lineup to cheaper, high-volume cars. Read more

Trucking companies have narrow margins given high costs of labor and fuel. Here’s how their revenue and expenses break down. Read more

Which companies and sectors generate the most profit per employee? We rank the top 25 companies in the U.S. based on this interesting metric. Read more

Today, China dominates the trade market, accounting for almost 15% of all merchandise. Read more

This graphic shows the evolution of global stock markets over modern history—highlighting the outsized influence of the U.S. market. Read more

Using our database of 700+ forecasts from reports, articles, interviews, and more, we highlight what experts think will happen in 2024. Read more

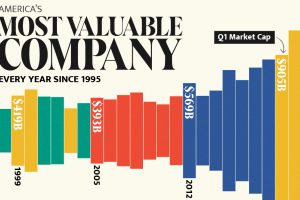
Over the last three decades, the growth of tech companies has driven a shift in the ranking of the most valuable companies in the U.S. Read more

The forecasted number of U.S. subscribers on major streaming platforms in 2027 shows that Prime Video will be the most popular by a wide margin. Read more


