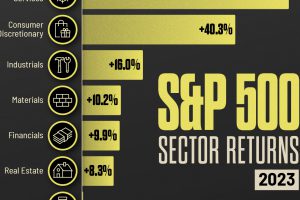
Which stocks are the most talked about online? Here are the top 10 stocks on Instagram and TikTok by content created about their shares. Read more

In this graphic, we’ve ranked the top S&P 500 stocks based on their 5-year total returns, as of November 2023. Read more
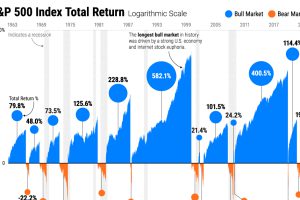
Stock market cycles often rhyme throughout history, shaped by monetary policy, consumer spending, and herd behavior. Read more
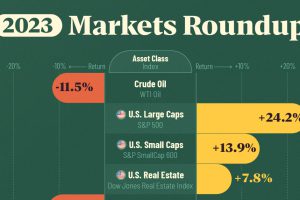
Between equities, real estate, commodities, bonds, and emerging markets, we track which major asset class ended the year on a positive note. Read more
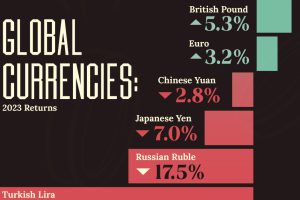
Euro, yen, and yuan—one is not like the other as we visualize the best and worst returns of the world’s major currencies. Read more
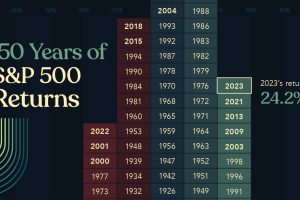
Last year, U.S. stocks took investors by surprise. This graphic shows S&P 500 historical returns since 1875 to put 2023 returns into context. Read more

The model mix in tesla’s global sales numbers has slowly changed from its luxury lineup to cheaper, high-volume cars. Read more

From cultural events that dominated headlines to geopolitical shifts and clashes, what major events defined 2023? Read more


