

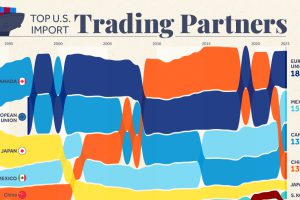
Nearly 60% of U.S. imports came from just four trade entities in 2023. We rank the top U.S. trading partners and show their growth over time. Read more
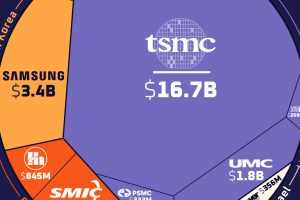
Most of the 10 largest semiconductor foundries in the world, are headquartered in just three Asian countries, accounting for 90% of the entire industry’s revenue. Read more

Here’s how investor sentiment has shifted over the last three decades, from the Dotcom boom to present-day. Read more

How poorly did ‘The Marvels’ perform in its opening weekend, and how do other Marvel box office returns compare? Read more
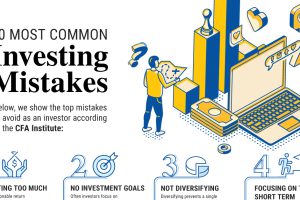
Here are the most common investing mistakes to avoid, from emotionally-driven investing to paying too much in fees. Read more

Considered a side show in the stock market for much of the last decade, U.S. retail investors are now breaking records. Read more
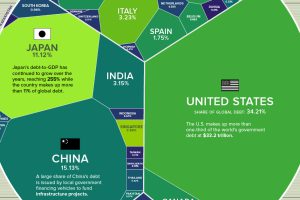
Global debt has soared since the pandemic. Which countries have the biggest stockpile of debt outstanding in 2023? Read more
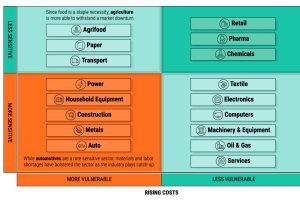
We show the sectors with the lowest exposure to recession risk—and the factors that drive their performance. Read more

Services-producing industries account for the majority of U.S. GDP in 2023, followed by other private industries and the government. Read more
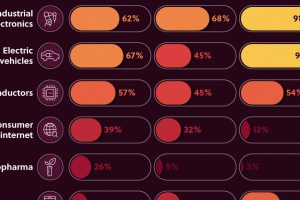
We look at the share of Asian companies in the top 3,000 global firms—measured by market capitalization in 2020—broken down by industry. Read more