

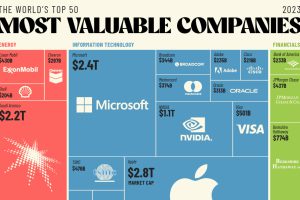
The world’s 50 most valuable companies represent over $25 trillion in market cap. We break this massive figure down by company and sector. Read more
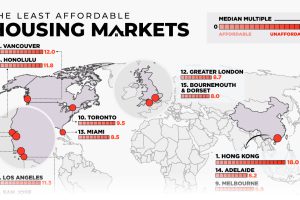
This map examines middle-income housing market affordability across eight major countries, highlighting some of the least affordable cities. Read more
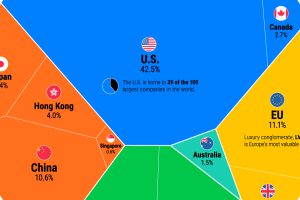
We show the entire global stock market in 2023, illustrating the dominance of U.S. markets. But as structural dynamics shift, will this last? Read more
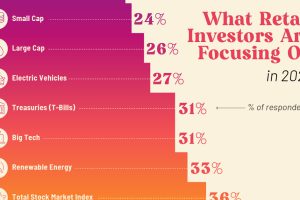
What key themes and strategies are retail investors looking at for the rest of 2023? Preview: AI is a popular choice. Read more

Where do the world’s wealthiest people want to live? This map tracks the migration of the world’s High Net Worth Individuals (HNWIs). Read more
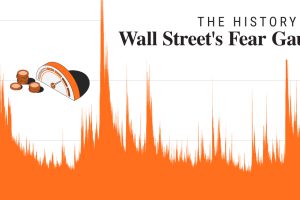
In 2023, market volatility has fallen dramatically. In this graphic, we show how it compares to historical trends. Read more

This graphic reveals the top 20 highest paid CEOs in the S&P 500 from Sundar Pichai to Jamie Dimon. Read more
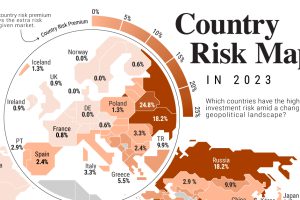
Where are some of the riskiest countries to invest in the world? Where are some of the safest? This graphic shows country risk in 2023. Read more
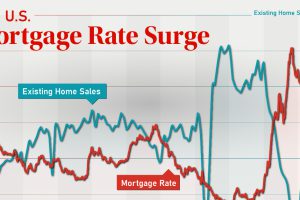
In this graphic, we take a look at the recent U.S. mortgage rate surge, and how the 30-year fixed-rate mortgage has evolved since 2013. Read more
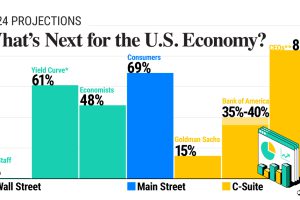
In this graphic, we show the probability of a U.S. recession in 2024, based on forecasts from Wall Street, Main Street, and the C-Suite. Read more