
At the height of its success, WeWork was valued at $47 billion. Four years later, WeWork is worth a fraction of the total. What happened? Read more

Cargo that moves through airports represents the value of around 35% of world trade. These hubs move the most cargo globally. Read more
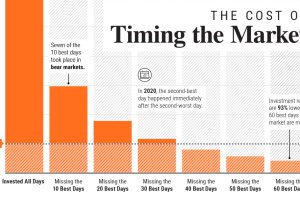
In this graphic, we show why timing the market is extremely difficult, and how it can meaningfully dent portfolio returns. Read more

How much does each country contribute to the $105 trillion world economy in 2023, and what nations are seeing their nominal GDPs shrink? Read more
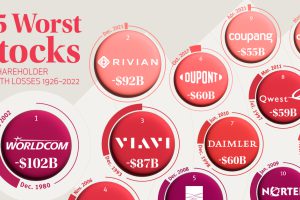
Among publicly-listed U.S. companies, the 25 worst stocks have lost shareholders a collective $1.2 trillion since 1926. Read more
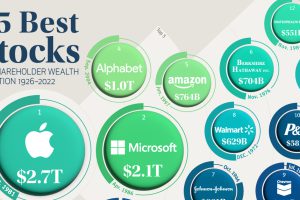
Accounting for just 0.1% of all public U.S. stocks, these companies have created nearly a third of all shareholder wealth since 1926. Read more
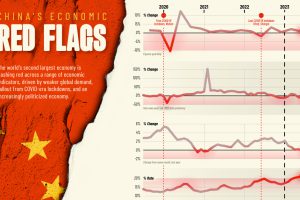
We chart six red flag indicators threatening China’s economy and it’s post-pandemic recovery, as well as global economic growth Read more
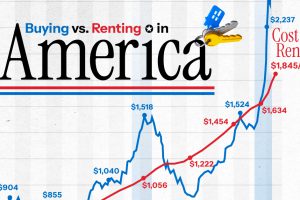
The U.S. has witnessed the biggest numerical gap in the monthly cost between buying a home and renting in over 50 years. Read more
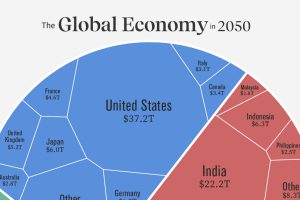
Asia is expected to represent the world’s largest share of real GDP in 2050. See how this all breaks down in one chart. Read more
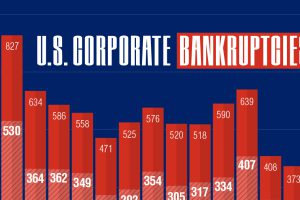
In 2023, over 400 companies have folded. This graphic shows how corporate bankruptcies are growing at the second-fastest rate since 2010. Read more

