

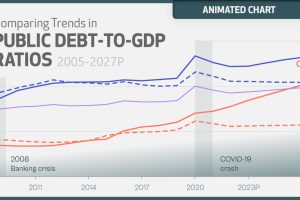
The surge in global debt poses significant risks to government balance sheets. Here’s where it’s projected to reach over the next five years. Read more
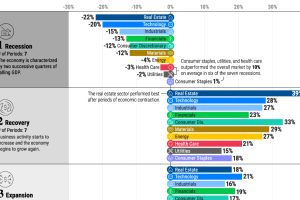
We show the best performing S&P 500 sectors over each phase of the business cycle using nearly seven decades of data. Read more
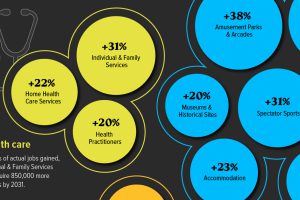
Key sectors in the U.S.—including Leisure and Health Social Services—are projected to be the fastest growing industries over the next decade. Read more
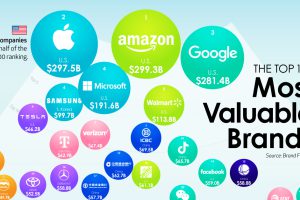
We show the top companies by brand value—and the brands that are rising the fastest as consumer expectations shift. Read more

We provide a historical and predictive overview of the top economies in the world, including projections all the way to 2075. Read more
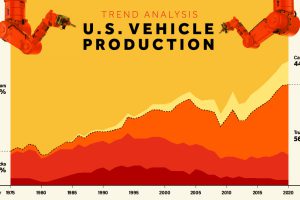
Visualize how U.S. vehicle production has shifted dramatically from cars to trucks, and especially to SUVs, since 1975. Read more

How does each state contribute to America’s overall GDP? This visualization breaks down the U.S. economy by state. Read more

Around 70% of U.S. adults claim to prefer ‘made in America’ products. This chart breaks down the demographics of patriotic purchases. Read more

The highest one-year return among the top S&P 500 stocks from 1980 to 2022 was a staggering 2,620%. Which stocks top the ranks? Read more
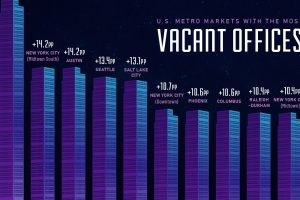
This visual showcases the top ten U.S. downtown areas with the fastest growing rate of vacant offices from the pre-pandemic era to 2023. Read more