

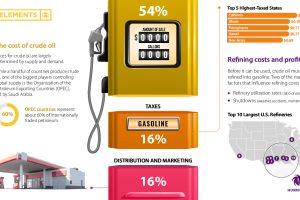
Gasoline prices across the U.S. have reached record-highs. Why? This graphic helps explain what factors influence the cost of gasoline. Read more

Looking to start a business? This map reveals America’s best states to do business in, analyzing everything from workforce to infrastructure. Read more
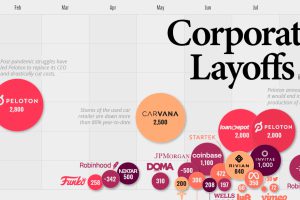
This infographic highlights the accelerating pace of layoffs so far in 2022, as businesses cut costs ahead of a potential recession. Read more
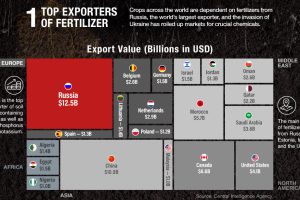
Bad weather, the war in Ukraine, and a shortage of fertilizer have led to fears of a global food crisis. Here are three factors you should know. Read more
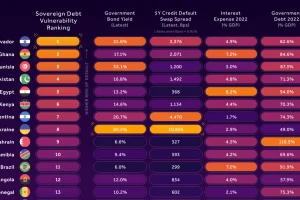
In this infographic, we examine new data that ranks the top 25 countries by their default risk. Read more
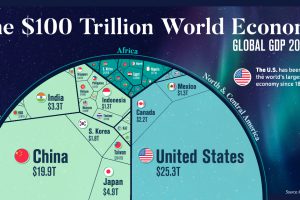
Despite ripple effects from conflict and inflation, global growth continues. According to the IMF, the global GDP will hit $104 trillion by end of year. Read more
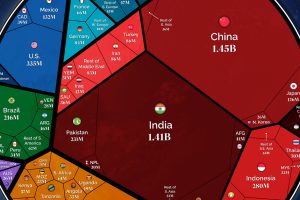
Our population will soon reach a new milestone—8 billion. These visualizations show where all those people are distributed around the world Read more
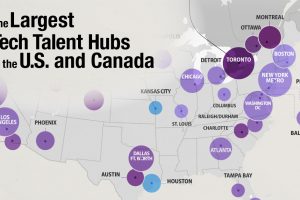
6.5 million skilled tech workers currently work in the U.S. and Canada. Here we look at the largest tech hubs across the two countries Read more
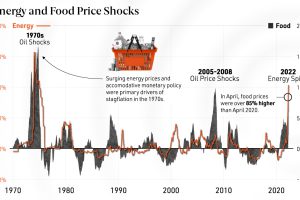
From rising inflation to food insecurity, we show why energy price shocks have far-reaching effects on the global economy. Read more
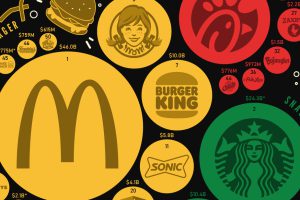
America has hundreds of options for quick and convenient food. But which fast food brands are the most popular, in terms of sales? Read more