

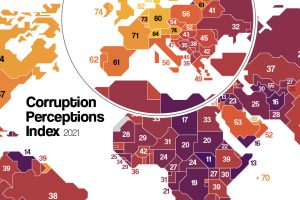
Which countries are the most (and least) corrupt? This map shows corruption around the world, and the movers and shakers over the last decade. Read more
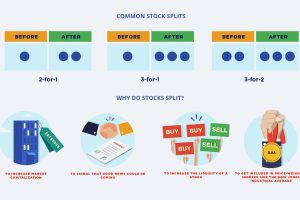
If companies want their stock price to rise, why would they want to split it, effectively lowering the price? This infographic explains why. Read more

Global debt reached $226T by the end of 2020 – the biggest one-year jump since WWII. This graphic compares the debt-to-GDP ratio of various countries. Read more
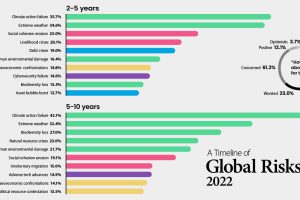
Which risks are top of mind in 2022? We visualize the World Economic Forum’s global risk assessment for top risks by impact and livelihood. Read more
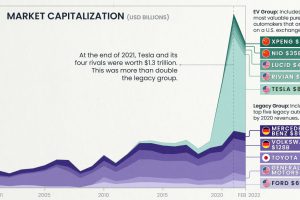
EV valuations have exploded since 2020, dwarfing those of legacy automakers like Ford and Toyota. Gain further insight with this infographic. Read more
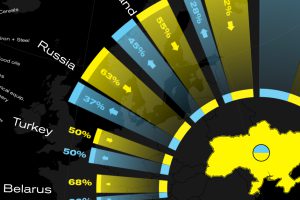
This graphic visualizes Ukraine’s top international trading partners and the country’s most exported and imported products in 2020. Read more

Do you have an eye for rare collectibles? See which items made the list of biggest auction sales in 2021. Read more

China’s lockdown of Shanghai is causing massive back-ups at the world’s largest container port. Hundreds of ships are now waiting at sea. Read more
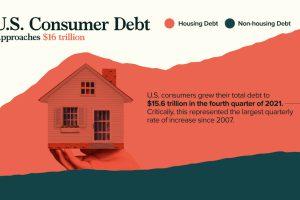
Robust growth in mortgages has pushed U.S. consumer debt to nearly $16 trillion. Click to gain further insight into the situation. Read more

Disappointing results have pushed Netflix shares down by over 60% year-to-date. This infographic puts the company’s rocky year into perspective. Read more